
Local Insights/Connecticut
Connecticut property intelligence
NE Provenance tracks 1,197,993 properties across 7 Connecticut counties and 133 municipalities — with 430+ intelligence attributes per parcel assembled from 140+ independent data sources. The median Connecticut property dates to 1963, with the oldest on record to 1639.

1,197,993
Properties
1963
Median Year Built
$263K
Median Assessed
8.2%
FEMA Flood Zone
Connecticut1788
Connecticut replaced its eight traditional counties with nine planning regions in 2022, making it the only New England state without county-level government. This administrative restructuring complicates property data aggregation — most national data providers still use the old county structure. NE Provenance maps every parcel to both the current planning region and the historical county, maintaining compatibility with legacy systems while reflecting the state's actual governance.
The state's 169 municipalities span a wide range — from dense urban centers like Hartford, Bridgeport, and New Haven to affluent suburban towns in Fairfield County and rural communities in the northeast hills. Connecticut's property stock reflects this diversity: Gilded Age estates, mid-century suburban ranches, historic town centers, and converted industrial buildings all coexist within the state's 5,543 square miles.
Long Island Sound coastline creates significant storm surge and flooding exposure for southern Connecticut communities. The state's position at the convergence of New England and Mid-Atlantic weather patterns produces unique hazard profiles — hurricane tracks that follow the Sound, nor'easters that drive coastal flooding, and ice storms that impact power infrastructure across the inland hills.
Property Landscape
1,197,993 properties across 7 counties
Property Types
Single Family
704,267
Residential Other
147,901
Condominium
117,190
Other
44,218
Institutional
43,210
Commercial
31,549
Vacant Land
29,219
Two-Family
24,151
Construction Eras
Pre-1800
4,425
1800–1899
40,098
1900–1949
226,787
1950–1969
290,134
1970–1989
226,722
1990–2009
128,318
2010+
30,493
County Coverage
7 of 9 Connecticut counties with full parcel intelligence
Capitol Planning Region
352,855
Properties
38
Municipalities
Western Connecticut
205,128
Properties
18
Municipalities
South Central Connecticut
185,580
Properties
16
Municipalities
Naugatuck Valley
157,794
Properties
19
Municipalities
Southeastern Connecticut
109,880
Properties
19
Municipalities
Greater Bridgeport
105,217
Properties
6
Municipalities
Lower Connecticut River Valley
82,957
Properties
17
Municipalities
Largest Communities
Top 20 municipalities by property count
Bridgeport35,983 properties · 1949
Norwalk30,133 properties · 1960
Waterbury29,273 properties · 1950
Danbury29,238 properties · 1972
Hartford28,594 properties · 1926
New Haven27,256 properties · 1920
Stamford25,723 properties · 1955
West Hartford22,211 properties · 1950
Stratford22,182 properties · 1959
Bristol21,939 properties · 1965
Fairfield20,359 properties · 1956
Milford19,408 properties · 1955
Greenwich19,383 properties · 1956
Manchester18,738 properties · 1957
New Britain17,396 properties · 1951
West Haven16,942 properties · 1955
Hamden16,747 properties · 1951
Wallingford16,660 properties · 1969
Meriden16,532 properties · 1953
Enfield15,944 properties · 1959

Authoritative Property Intelligence for New England
Risk-based analytics and due diligence for 4.7+ million residential and commercial properties across
Massachusetts, Connecticut, New Hampshire, Rhode Island, Maine, and Vermont.
What we cover in Connecticut
Every property in our Connecticut coverage area includes these intelligence layers — all assembled from independent sources, not resold assessor data.
Building & Site
Year built, square footage, construction type, roof material, foundation, lot dimensions, zoning, architectural style, and occupancy status.
Permits & Condition
Condition estimate (C1–C6) derived from permit timeline. System ages for electrical, plumbing, HVAC, and roof. 415,397 Connecticut properties with permit data.
Risk & Hazards
Fire protection grade (A–E), FEMA flood zones (8.2% SFHA), storm surge, sea level rise, wind speed, seismic hazard, wildfire, radon, and vacancy risk.
Environmental
Wetlands proximity, dam exposure, contamination records, historic designation, conservation lands, and environmental justice indicators.
Ownership & Valuation
Owner name and entity type, deed chain with sale prices, mortgage and lien analysis, assessment breakdown, and NEP Market Value Indication.
Neighborhood
Fire station distance, school districts, demographics, median income, utilities, and community resilience indicators.
Explore the intelligence for yourself
Open a Property Wallet for a real New England property. With over 4.7 million similar records across all six New England states, see how it fits into your workflow.
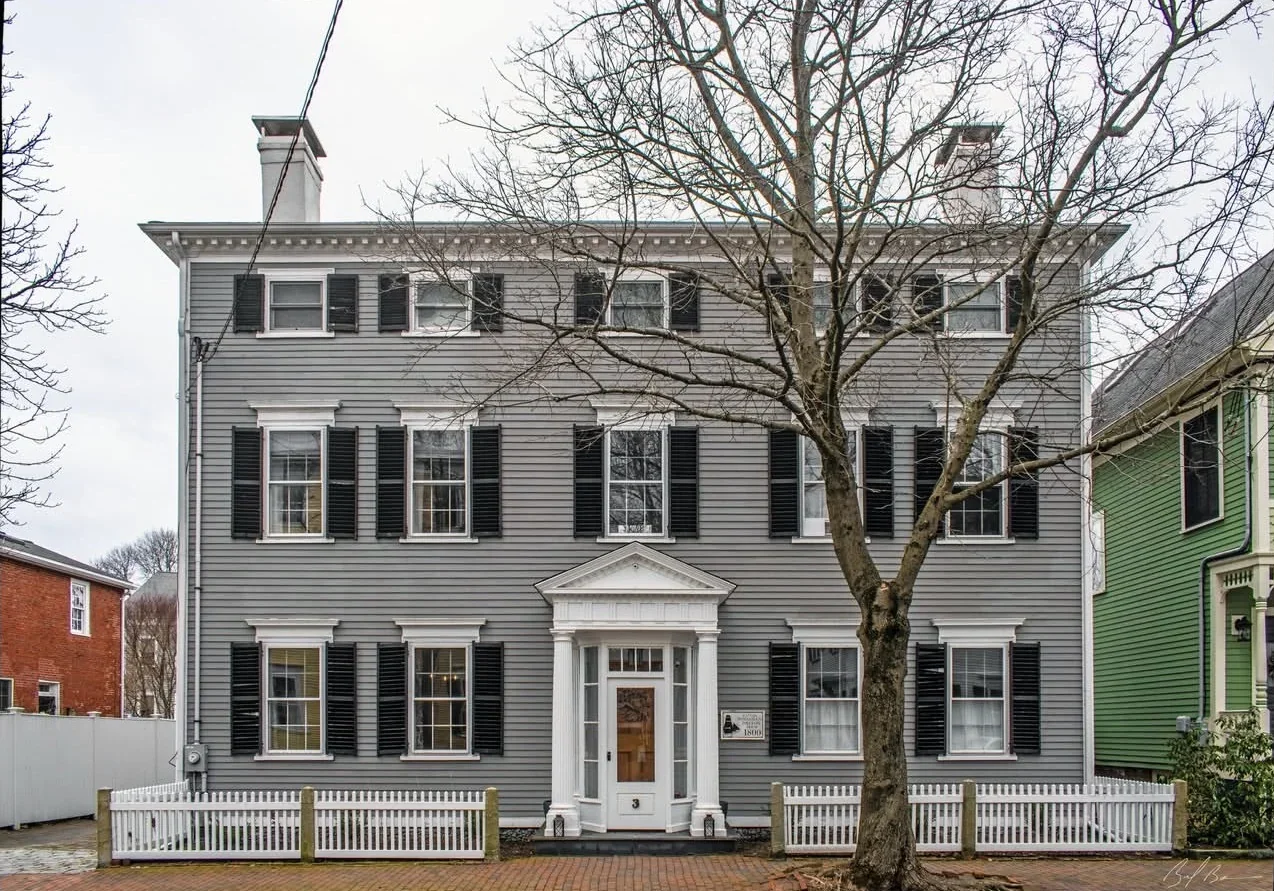
Newburyport, MA · Federalist · 3,524 sq ft · 4 bed / 3 bath · Built 1800 · Historic District
NEP Property Intelligence Summary
ConditionC1Fire ClassBFlood ZoneXOwnerIndividualOccupancyOwner-Occupied
Purchased2018 (8yr)Permits11 total · 4 in 5yrSystems3 updated · newest 0yrLiensClearAssessed$1.6MOcean0.3 miSurgeCat 2
EraPre-1940HistoricDesignatedRenovationRecent (5yr)CommercialNo Business ActivityRadonZone 1 — Highest
AES-256 encryption
US-hosted infrastructure
CCPA compliant
Customer data never sold or shared
Authoritative, primary sources
PostgreSQL — enterprise-grade infra