Solutions/Insurance
Property data for the entire carrier enterprise
NE Provenance is more than a data provider. It's an intel platform purpose-built for teams that manage carriers' core insurance functions: underwriting, actuarial & modeling, product, claims, distribution, marketing… every department that touches property risk and supports insurance operations.
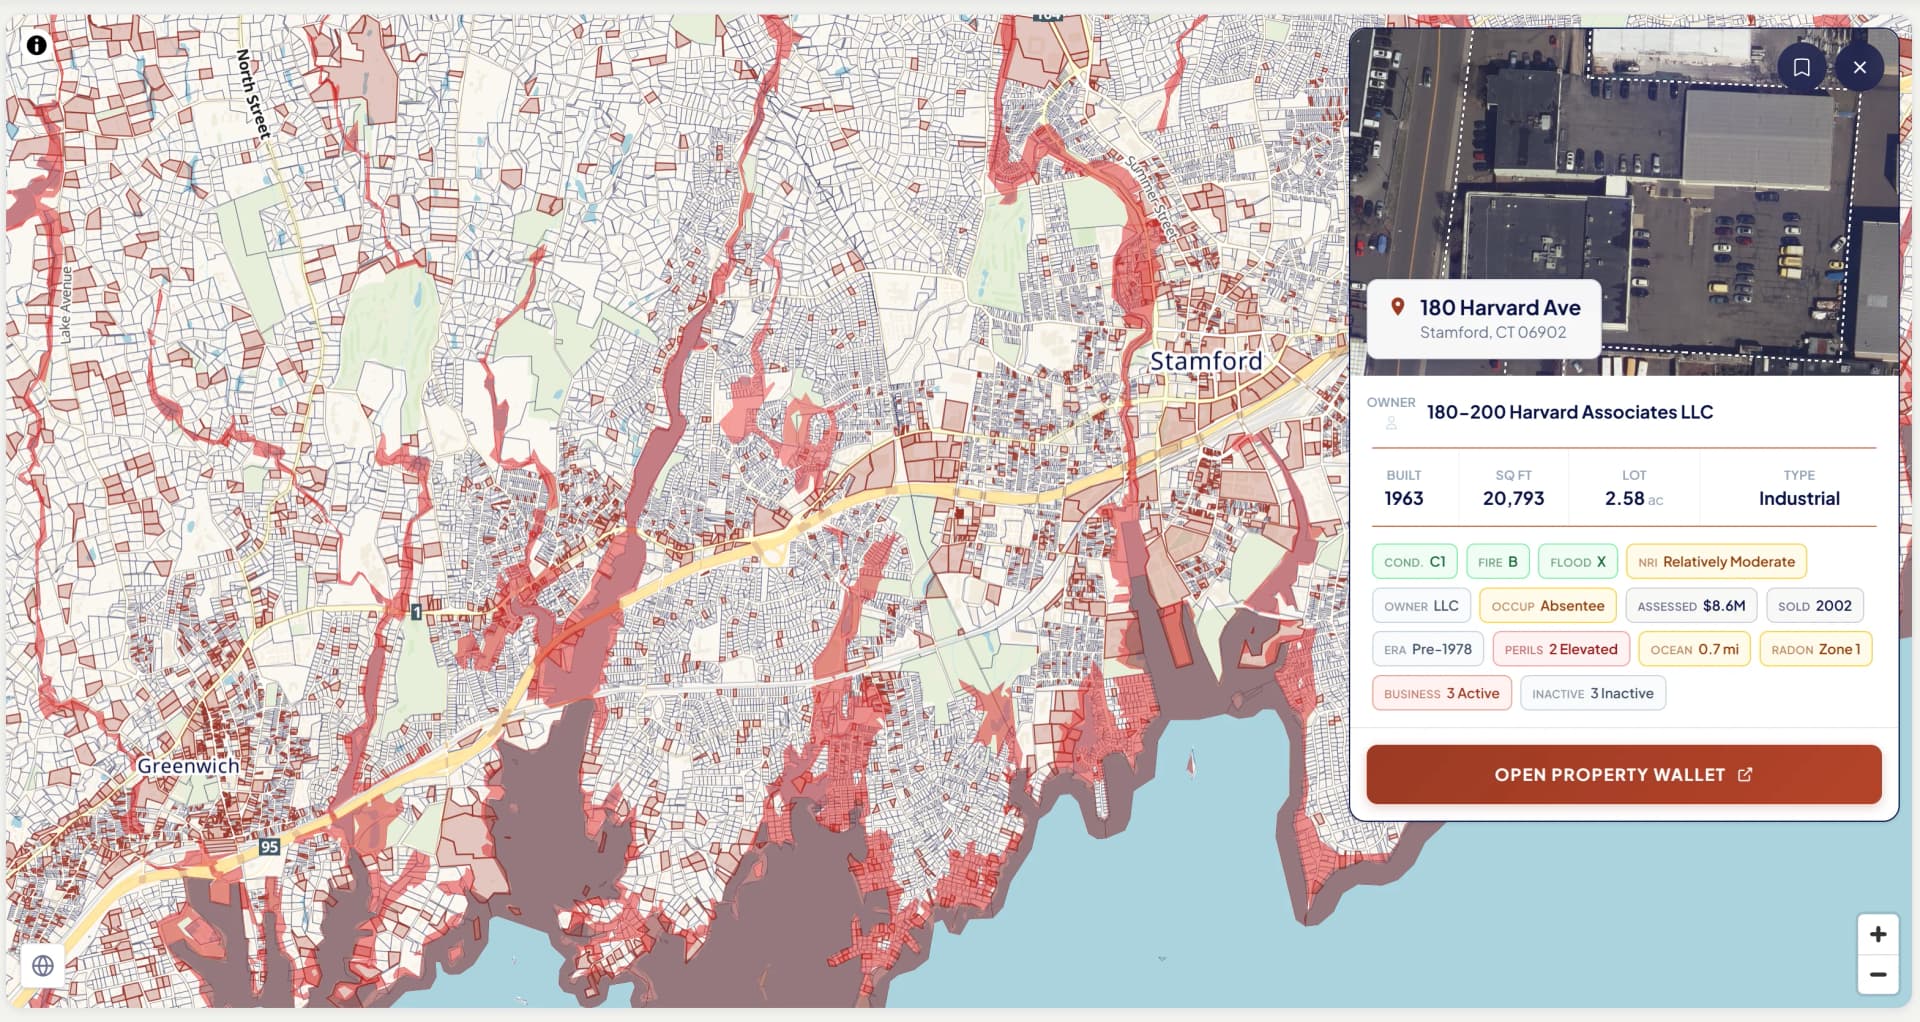
The same intelligence foundation — over 1 billion data points triangulated from hundreds of sources, aerial imagery, permit-driven condition ratings, hazard exposure, risk flags and more across New England's population centers — powers different workflows across your organization. Deep regional insurance analytics and insights that drive outperformance in a market that serves over 13M individual insurance consumers.
Across your organization
One platform, every department that touches property risk
Insurance carriers are organized by department, not by data type. NE Provenance maps to how your organization actually works — the same underlying intelligence, presented for the workflow each team runs every day.
Underwriting, Actuarial & Modeling
Personal lines, commercial lines, portfolio, product, CAT underwriting, actuarial modeling, and rate development
Property data from 140+ sources for individual submissions — building characteristics, condition ratings, hazard exposure, ownership, and where available, permit history and systems age. Portfolio-level condition and risk data for territory management. Parcel-level CAT exposure for hazard underwriting. The first dataset in New England that links physical property condition to the characteristics actuaries use for rate development.
Underwriting & modeling deep divePersonal Lines Underwriting
Property-level accept/reject decisions on individual submissions — condition, construction, risk indicators, systems age
Commercial Lines Underwriting
Everything PL needs plus business classification, ISO/BOP codes, cooking operations, alcohol service, hazmat presence
Portfolio / Territory Underwriting
Condition distributions, age cohorts, permit activity rates, and risk concentrations across 5,000+ property territories
Product Underwriting
Segment profitability analysis — slice portfolios by construction type, age, condition, territory, owner type, and risk factors
CAT / Hazard Underwriting
Parcel-level flood, surge, wind, hail, and wildfire exposure — not ZIP-level aggregates
Actuarial
Property-level characteristics correlated with loss experience — construction, condition, age, territory, systems age — for rate-making and experience studies
CAT Modeling
Parcel-level exposure data by peril, geography, and construction class — enabling portfolio accumulation analysis and probable maximum loss estimation
Claims & Loss Control
Pre-loss documentation, fraud support, CAT response, subrogation, and proactive risk mitigation
Condition data, building characteristics, hazard exposure, and where available, permit history and deed records — assembled before any loss event. When a claim comes in, your adjuster sees the property picture, not a blank file. After a CAT event, triage your portfolio in the affected area by pre-existing condition.
Claims & loss control deep diveClaims Adjuster
Pre-loss condition documentation with timestamped imagery — roof, siding, foundation state before the loss event
SIU / Fraud
Compare claimed damages against documented pre-loss conditions — objective, timestamped evidence
CAT Response
Portfolio-level triage after major weather events — identify pre-existing issues vs. likely legitimate claims at scale
Subrogation
Pre-loss evidence supporting recovery efforts — construction defects, contractor records from permits, neighbor property state
Loss Control
Proactive identification of highest-risk properties — permit-gap cohorts, fire protection gaps, environmental exposure
Distribution & Marketing
Territory prospecting, lead qualification, and data-driven distribution strategy
Filter properties by owner type, condition, coverage gaps, and territory desirability — then export data-qualified prospect lists. Leads are backed by condition data, building characteristics, ownership data, and permit history where available.
Sales / Territory Manager
Data-qualified prospect lists — "1,200 owner-occupied homes across coastal Connecticut with C4+ condition, assessed over $500K, no building permit in 10 years"
Agency Manager
Territory desirability analysis — condition distributions, growth rates, and market opportunity by geography
Data delivery
Your workflow, our data, however you need it
An underwriter needs to drill into one property at point of quote. A portfolio manager needs to enrich 5,000 addresses from a book review. A CAT modeler needs bulk exposure data in their warehouse. An actuarial team needs enrichment columns joined to their own loss data. Same data — delivered the way each team works.
Portfolio Enrichment
Upload your book of business by address. We return 430+ attributes per property — condition, systems, hazard, ownership, environmental, commercial. Your data stays with you. Our data enriches it. Match by address or by owner to see the complete property picture behind every policyholder.
API & Batch Integration
Per-address REST API for point-of-quote enrichment. Batch endpoint for up to 10,000 addresses per request. Nightly Parquet snapshots with incremental deltas for warehouse integration. Our data moves in beside your existing columns — no manual lookups required.
Search & Discovery
AI-native search across 4+ million parcels. 247 filter attributes, 30+ spatial overlays, natural language queries. "Show me wood-frame coastal properties in flood zones with C4 or worse condition." Export the results or feed them into your workflow.
Property Wallet
Deep-dive data on any individual property — 430+ attributes across 8 tabs with built-in data provenance. The interactive exploration layer that makes the data tangible. Export individual property reports as PDF for the underwriting file.
The data behind every answer
Raw facts are evidence. Intelligence is what we sell. Over 1 billion data points from 140+ sources serve as the foundation — not the product. We triangulate across sources to answer specific questions about each property, with provenance showing what we checked, what we found, and when.
Authoritative Sources
Municipal assessors, FEMA flood maps, state environmental agencies, NOAA, USDA soils, EPA, NFIRS fire incidents, registries of deeds, and county permit offices across 530+ New England communities
Derived Intelligence
Permit-derived systems age, NEP Condition Rating (C1–C6/NR), NEP Fire Protection Grade (A–E), NEP Estimated ISO class, entity detection, portfolio resolution, risk flags, and aerial imagery from all 6 state programs
Public Records Substrate
Building permits, deed transfers, mortgage recordings, lien filings, assessor updates, and ownership changes — sourced from county registries and municipal offices, refreshed as jurisdictions publish new records. Coverage varies by county and is expanding.
Standards & compliance
Built for carrier compliance from day one
Data points carry provenance — the source chain showing where data originated, who handled it, when it passed through each step. This isn't an afterthought; it's the architecture.
Our methodology aligns with state insurance bulletins on imagery-based underwriting (Massachusetts Bulletin 2025-02, Rhode Island, New Hampshire) and industry standards for property data.
COPE
Construction, Occupancy, Protection, Exposure — the four factors that define property risk
ISO
NEP Estimated ISO classification codes for commercial properties from triangulated business intelligence
NEP C1–C6/NR
Permit-activity-based condition estimate — transparent methodology, every input traces to a dated municipal record
ACORD
Export formats compatible with carrier systems and industry data exchange standards
FEMA NFIP
Flood zone designations, community ratings, and NFIP claims data integration
ASTM E2018
Property Condition Assessment standard alignment for commercial properties
Working together
We understand your operation because we've built them
17 years inside carrier operations
NE Provenance was founded by a former Senior Director and VP of Underwriting at a top-5 P&C carrier who built the workflows underwriters use every day. We know exactly what data is missing because we spent 17 years working around the gap.
We're not approaching insurance from the outside. We're rebuilding the data layer from the inside out — with the operational knowledge to make it work within existing carrier systems, compliance requirements, and decision frameworks.
We work directly with carriers to get this right
Whether you're exploring a pilot on a specific book segment, evaluating our data against what you're using today, or ready to discuss a full integration into your underwriting or claims workflow — we'll take the time to understand your operation and make sure the data fits.
Every conversation starts with Mike directly — the same person who built the pipeline and understands the carrier workflows this data serves.
Explore the intelligence for yourself
Open a Property Wallet for a real New England property. With over 4.7 million similar records across all six New England states, see how it fits into your workflow.