AuthoritativePropertyInsuranceIntelligence
New England's largest and most intelligent property data record, triangulated from 140+ independent sources, covering 4.7M+ residential & commercial properties. Risk-based analytics and deep due diligence, leveraged by your professional expertise, available however you consume it.

AuthoritativePropertyInsuranceIntelligence
New England's largest and most intelligent property data record, triangulated from 140+ independent sources, covering 4.7M+ residential & commercial properties. Risk-based analytics and deep due diligence, leveraged by your professional expertise, available however you consume it.























Authoritative Property Intelligence
for New England
Risk-based analytics and due diligence for 4.7+ million residential and commercial properties across
Massachusetts, Connecticut, New Hampshire, Rhode Island, Maine, and Vermont.
Big Data Window
Professional property search cockpit
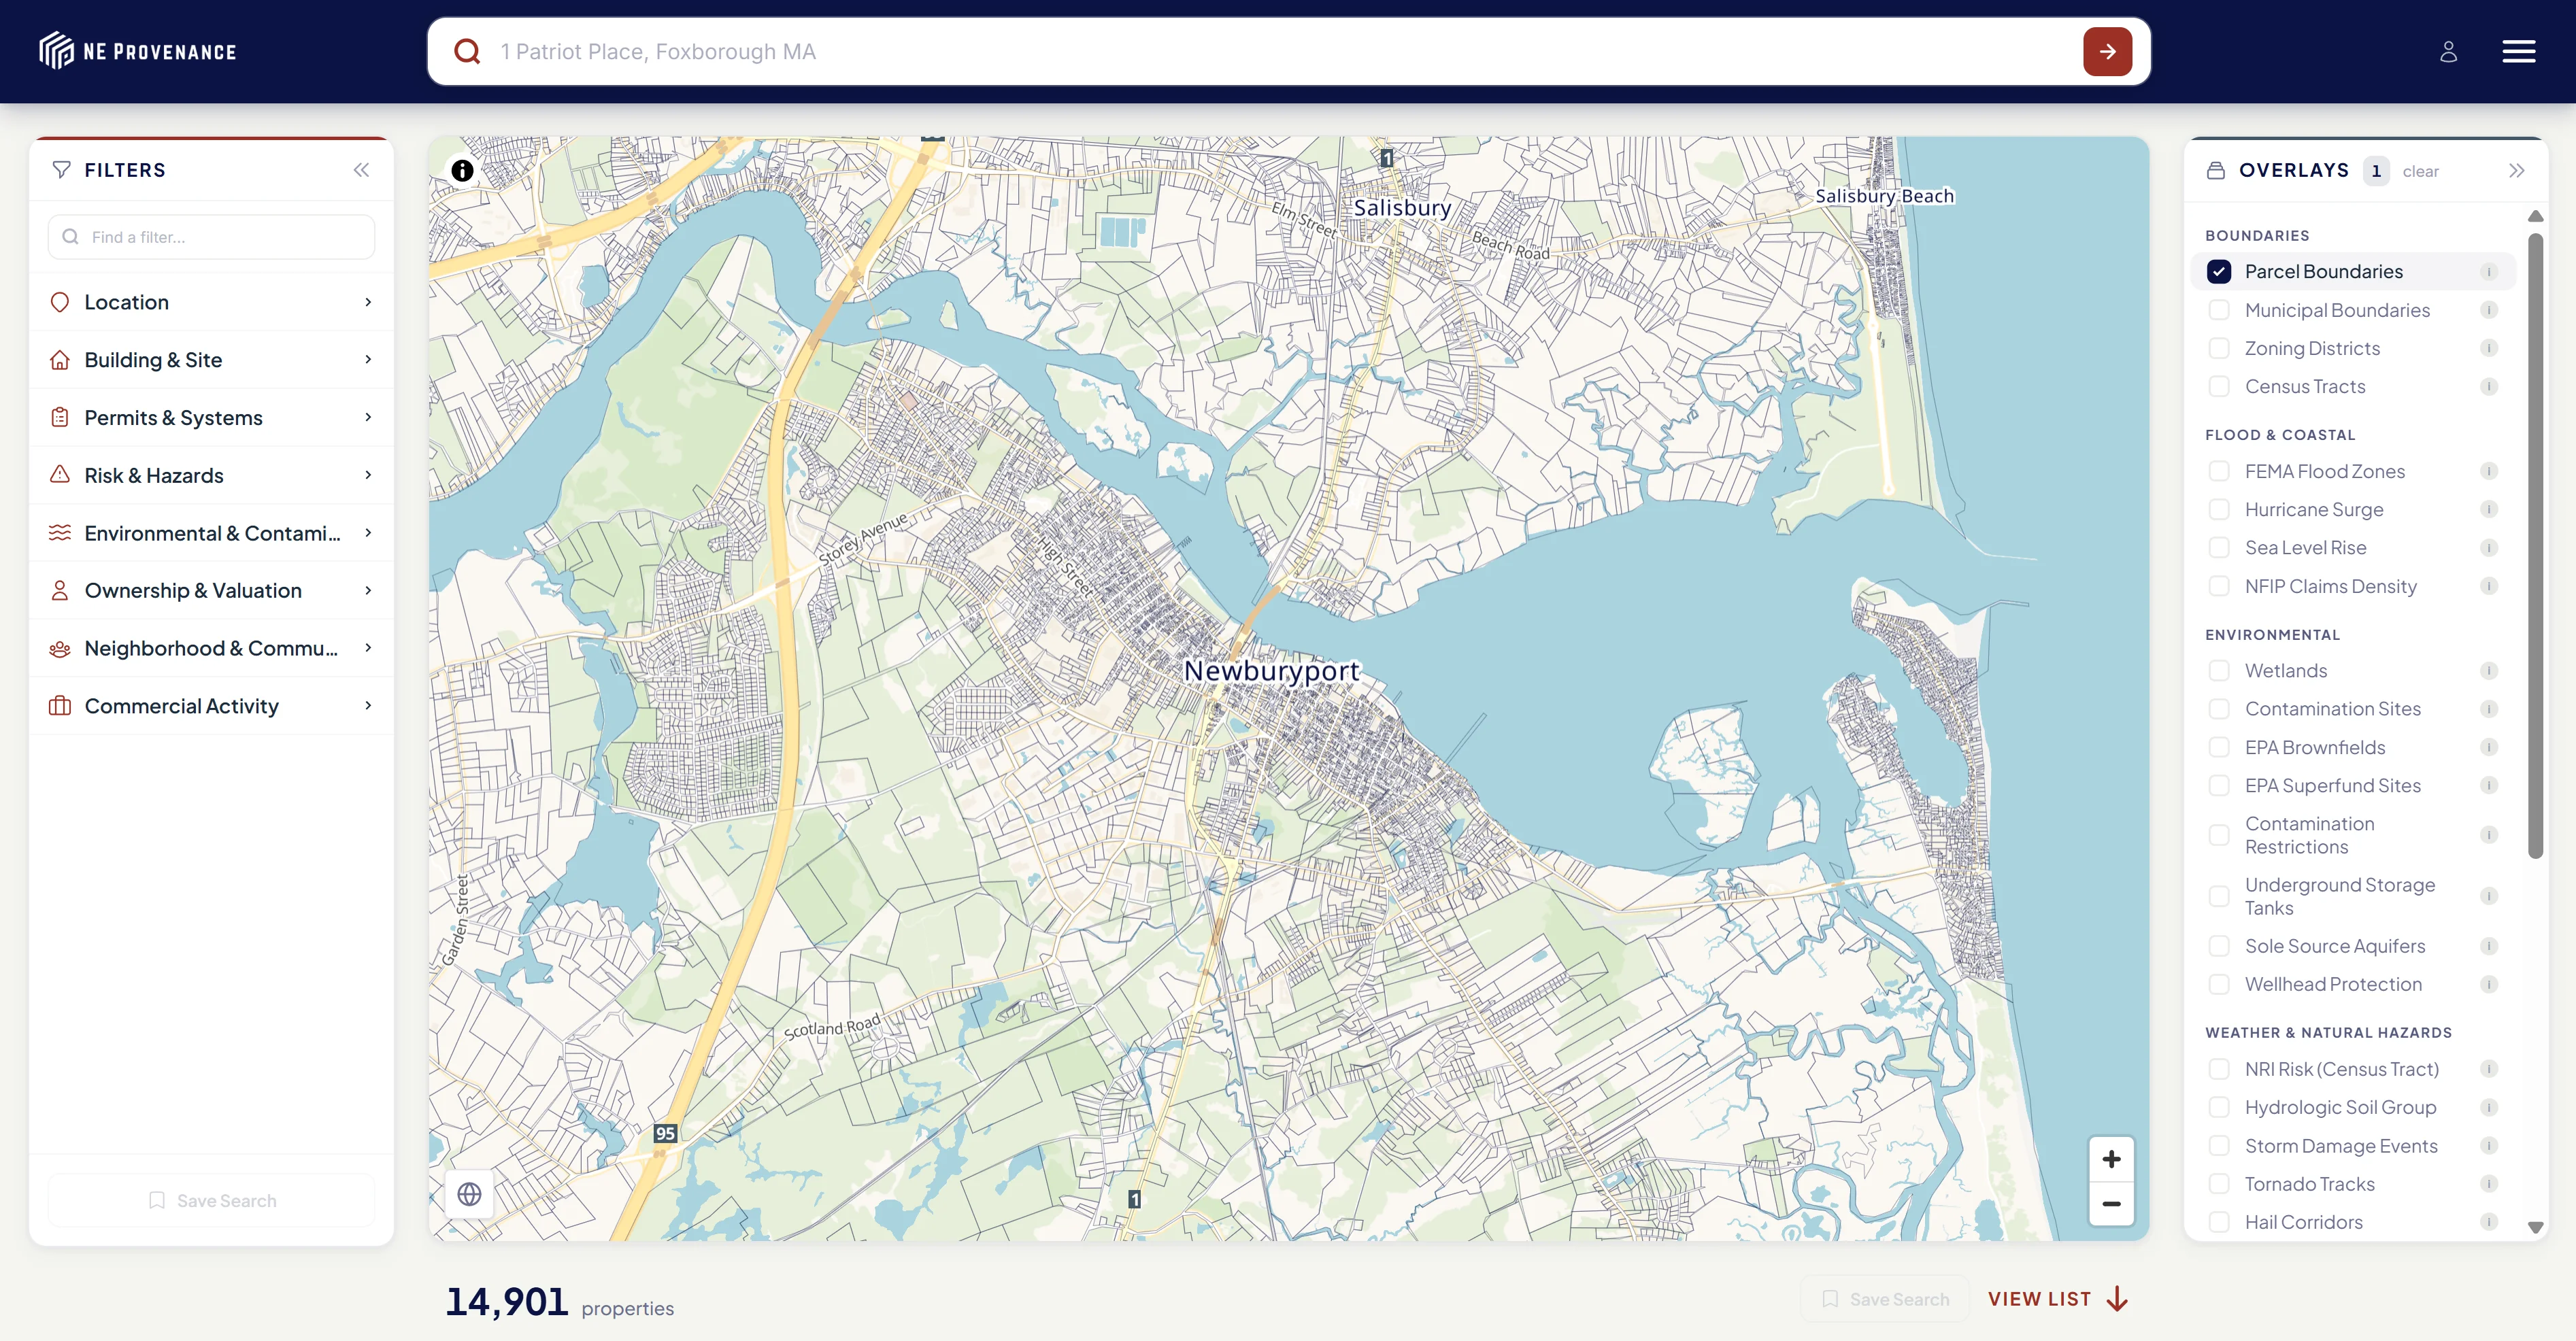
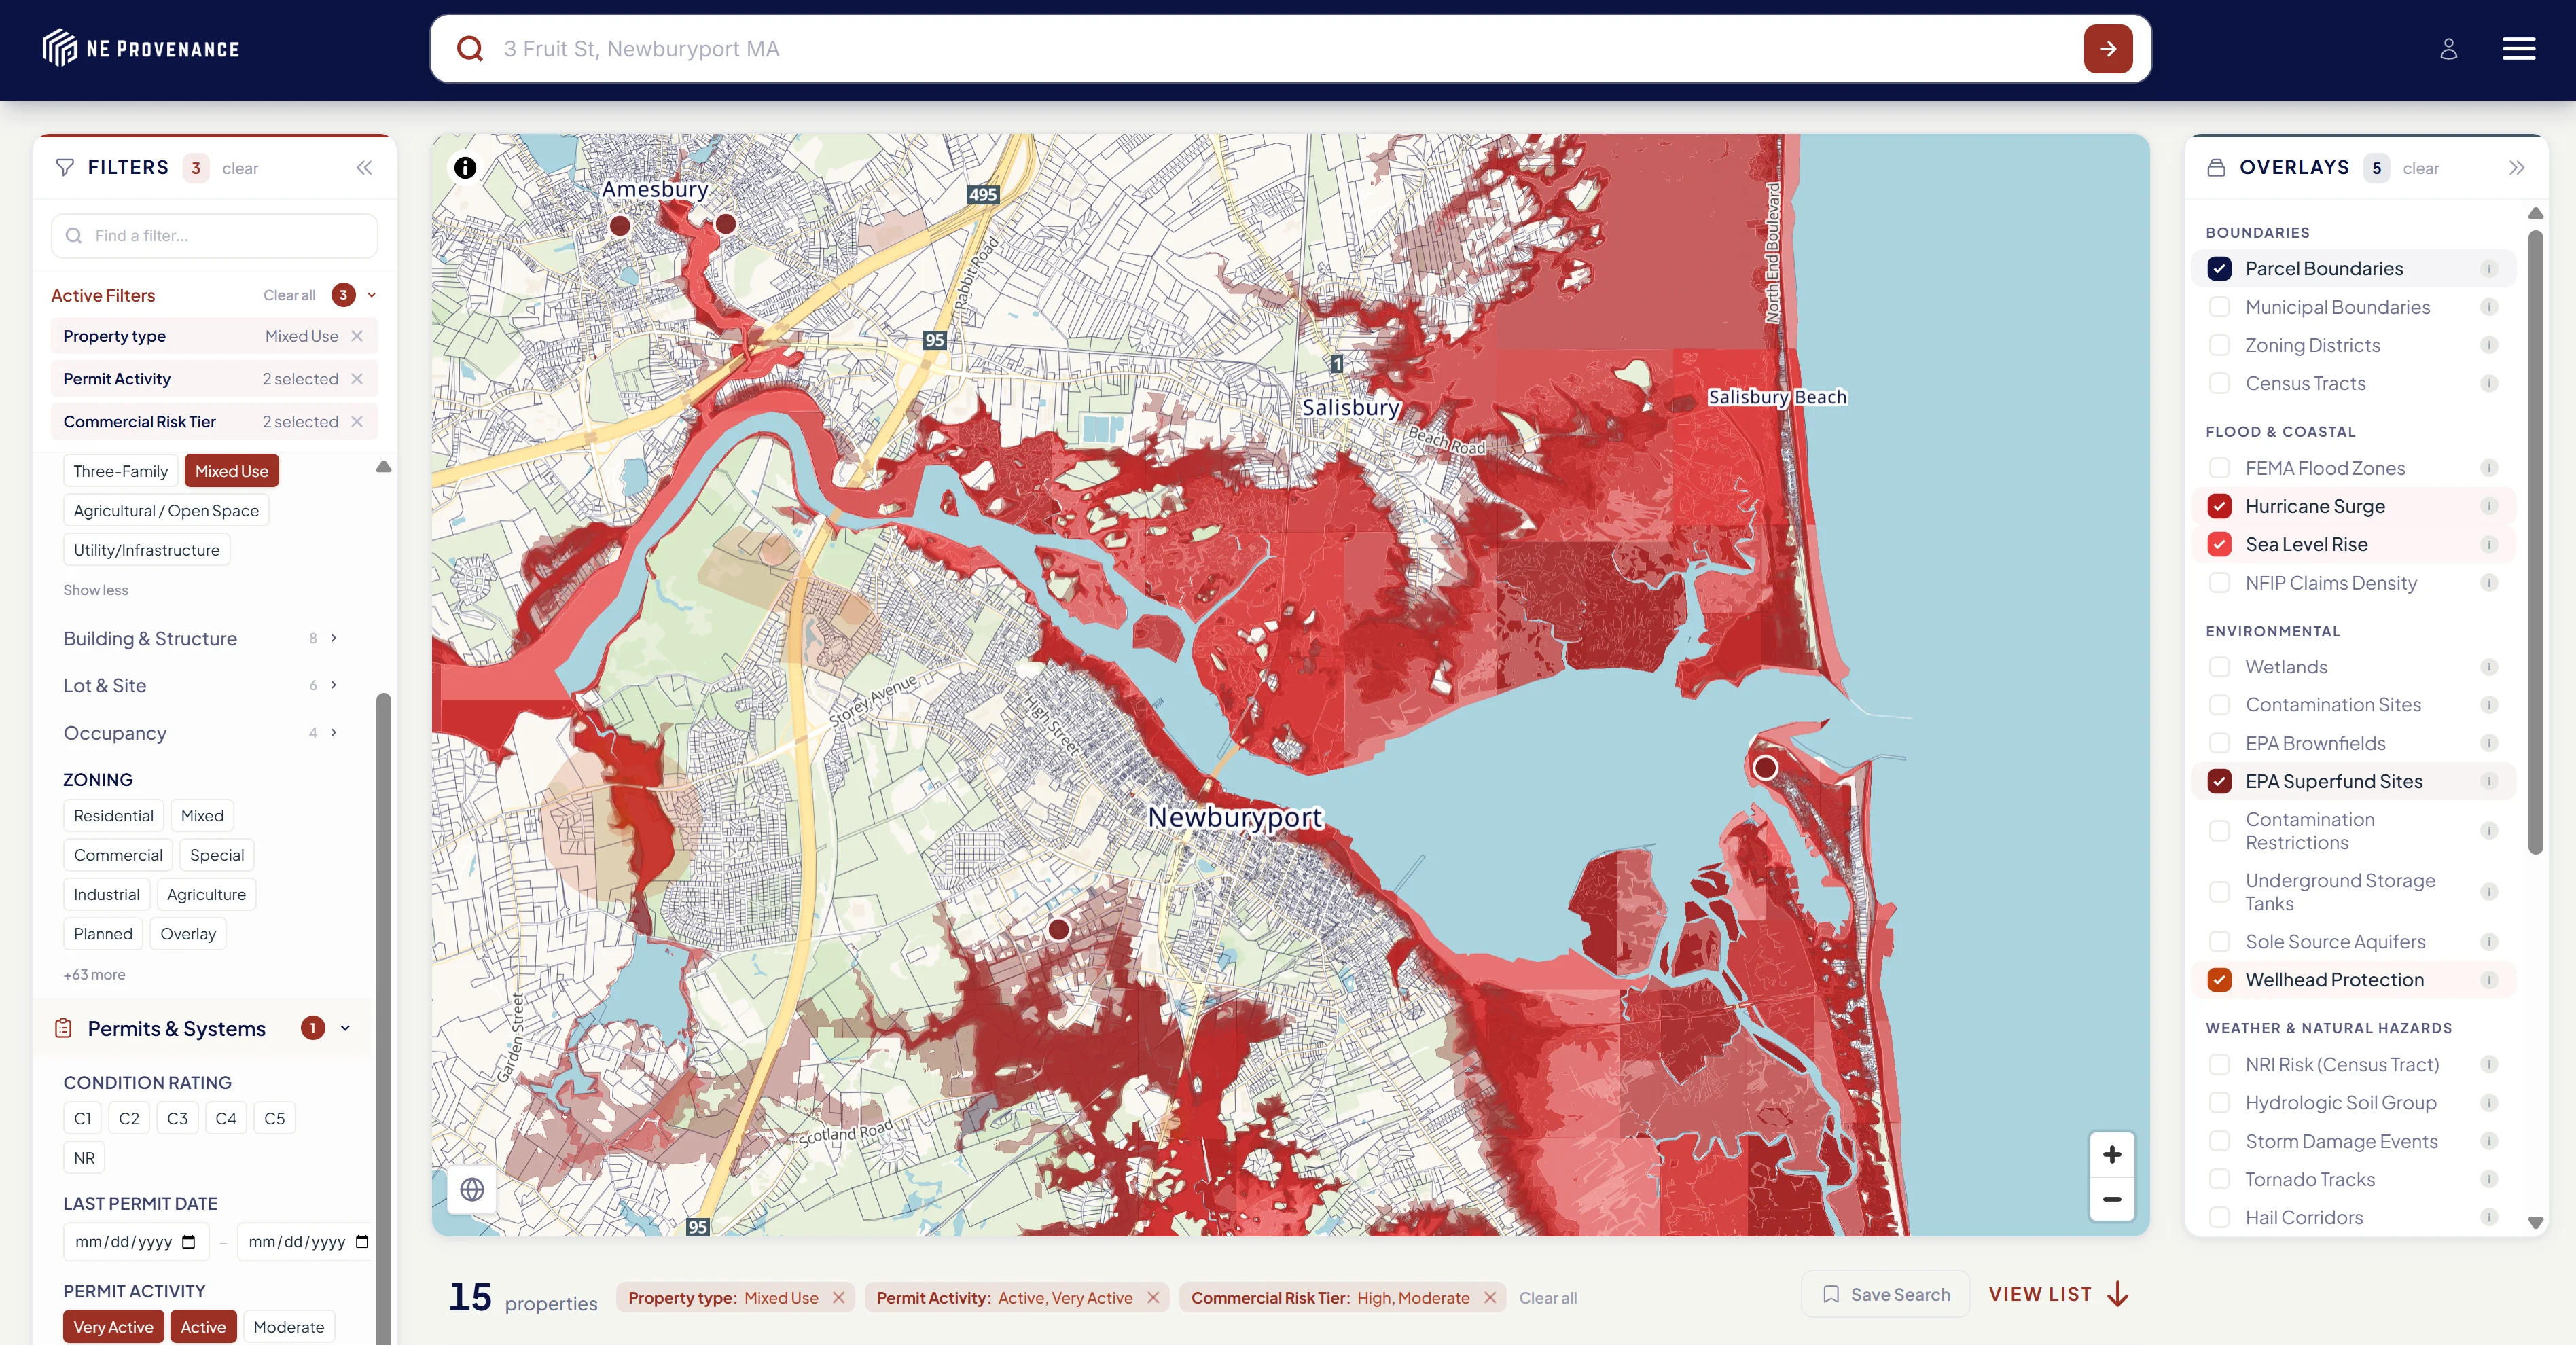
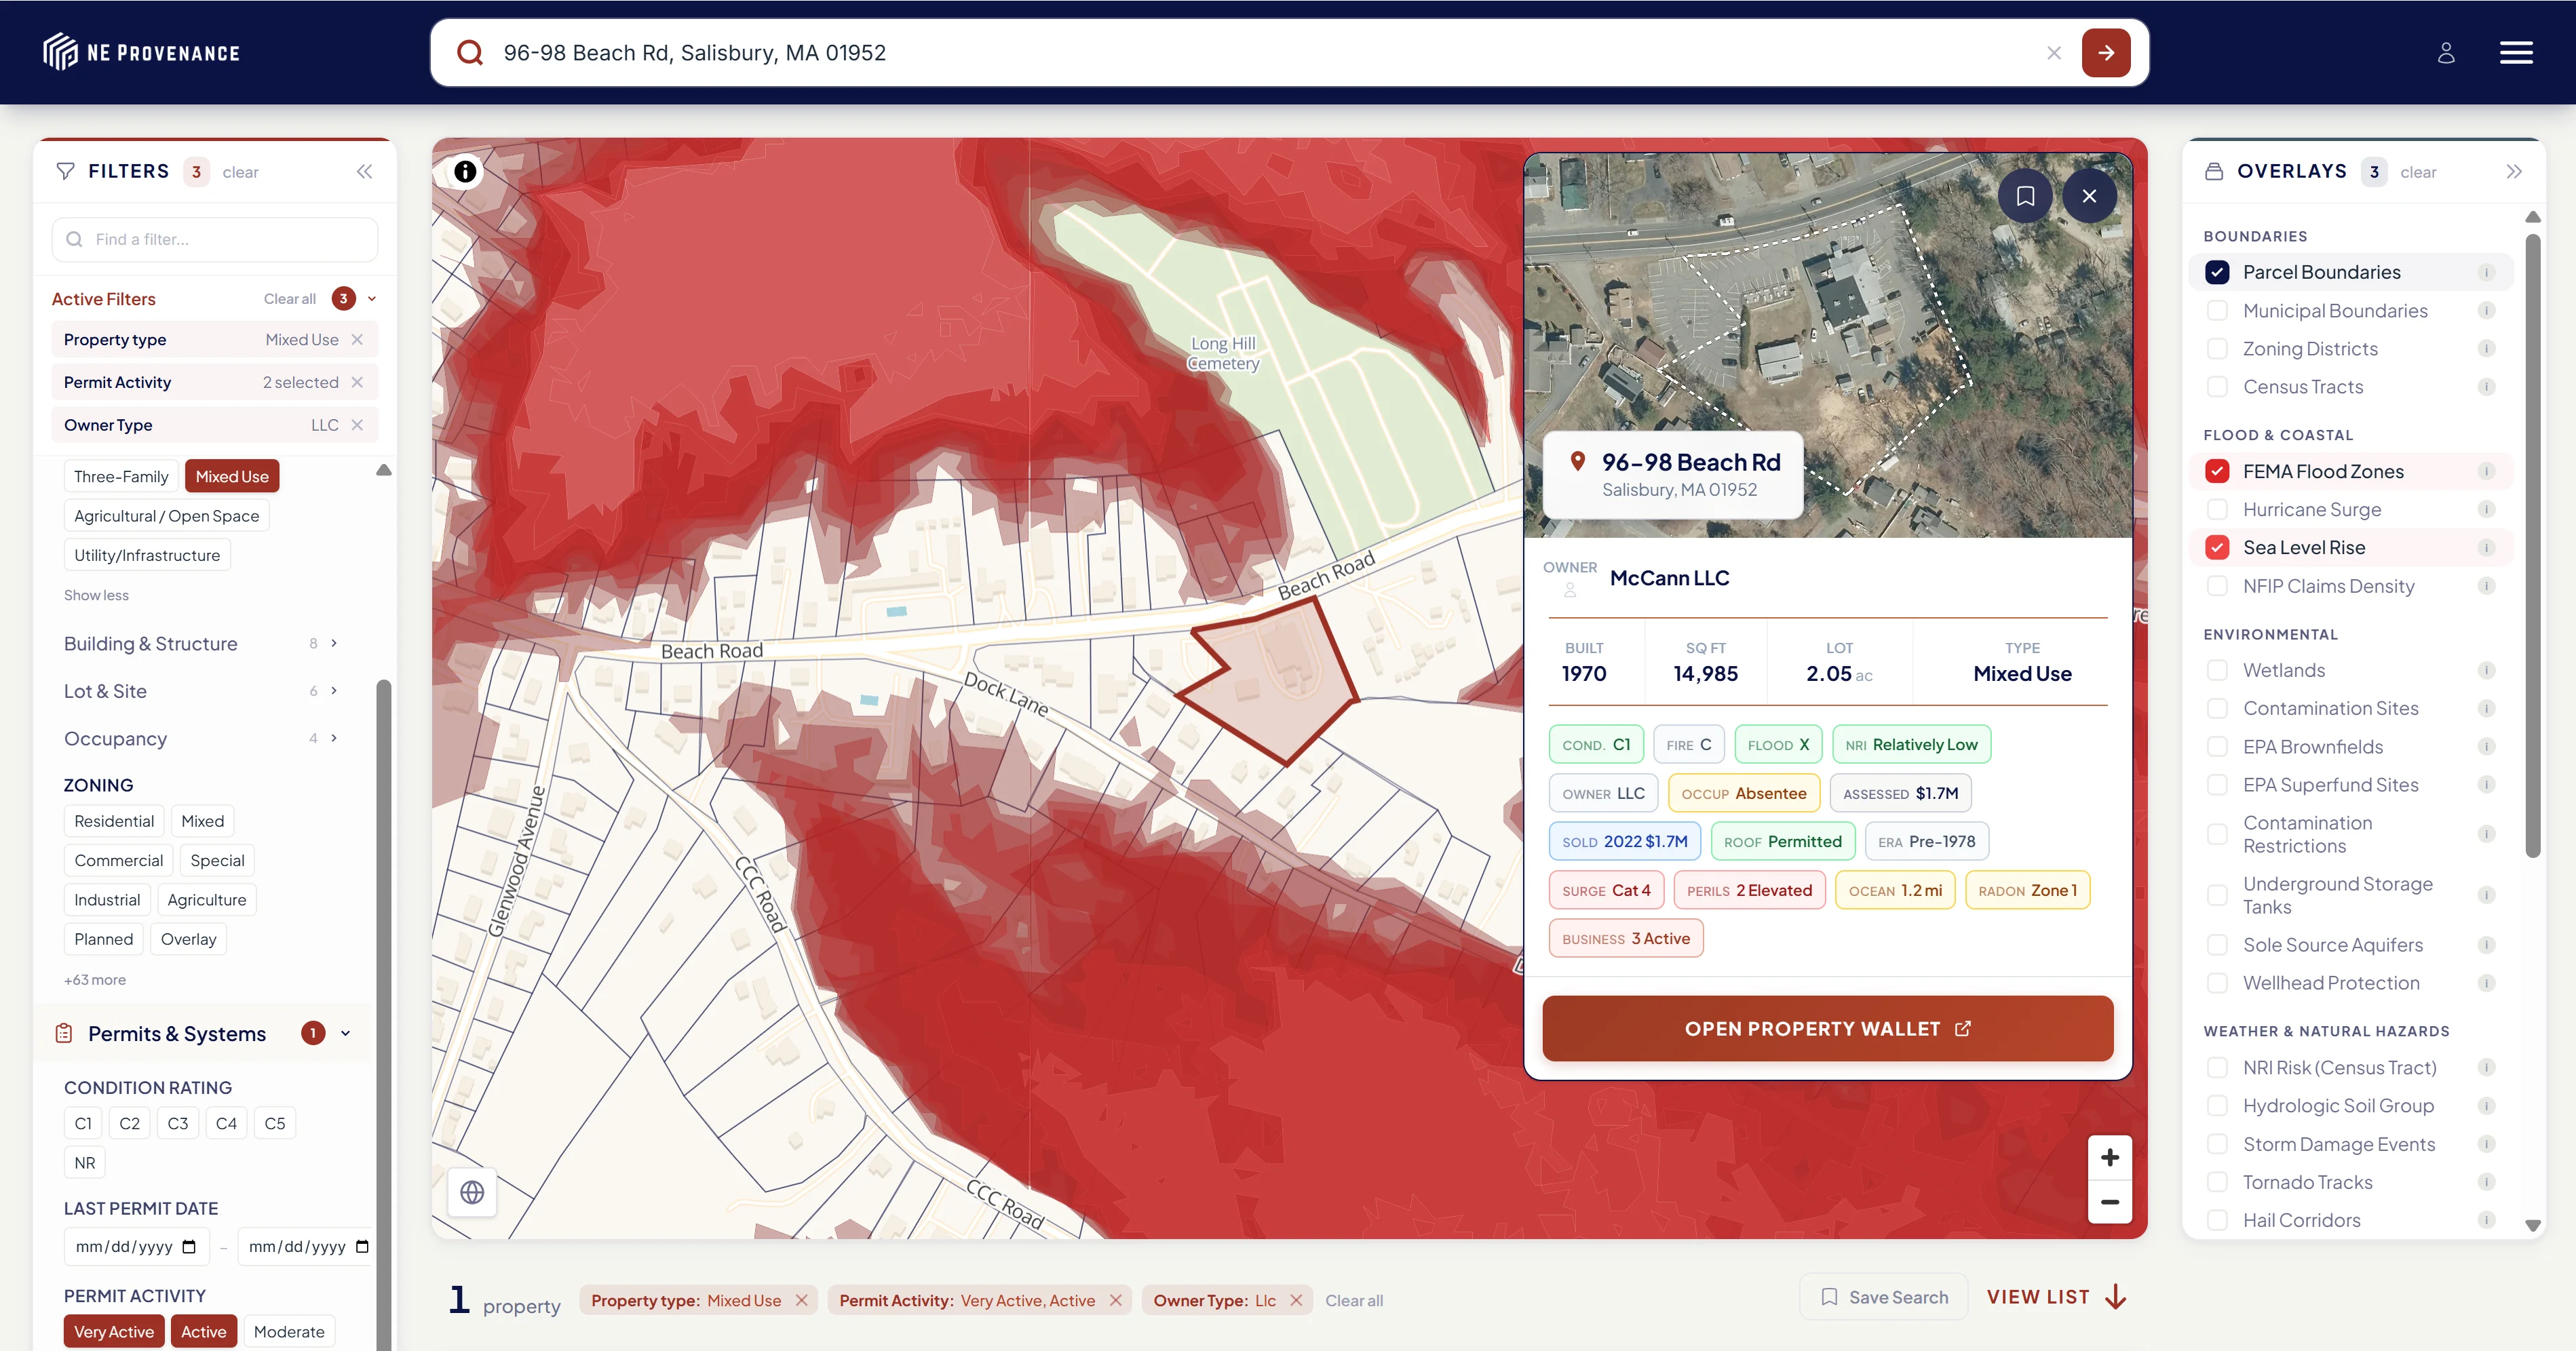
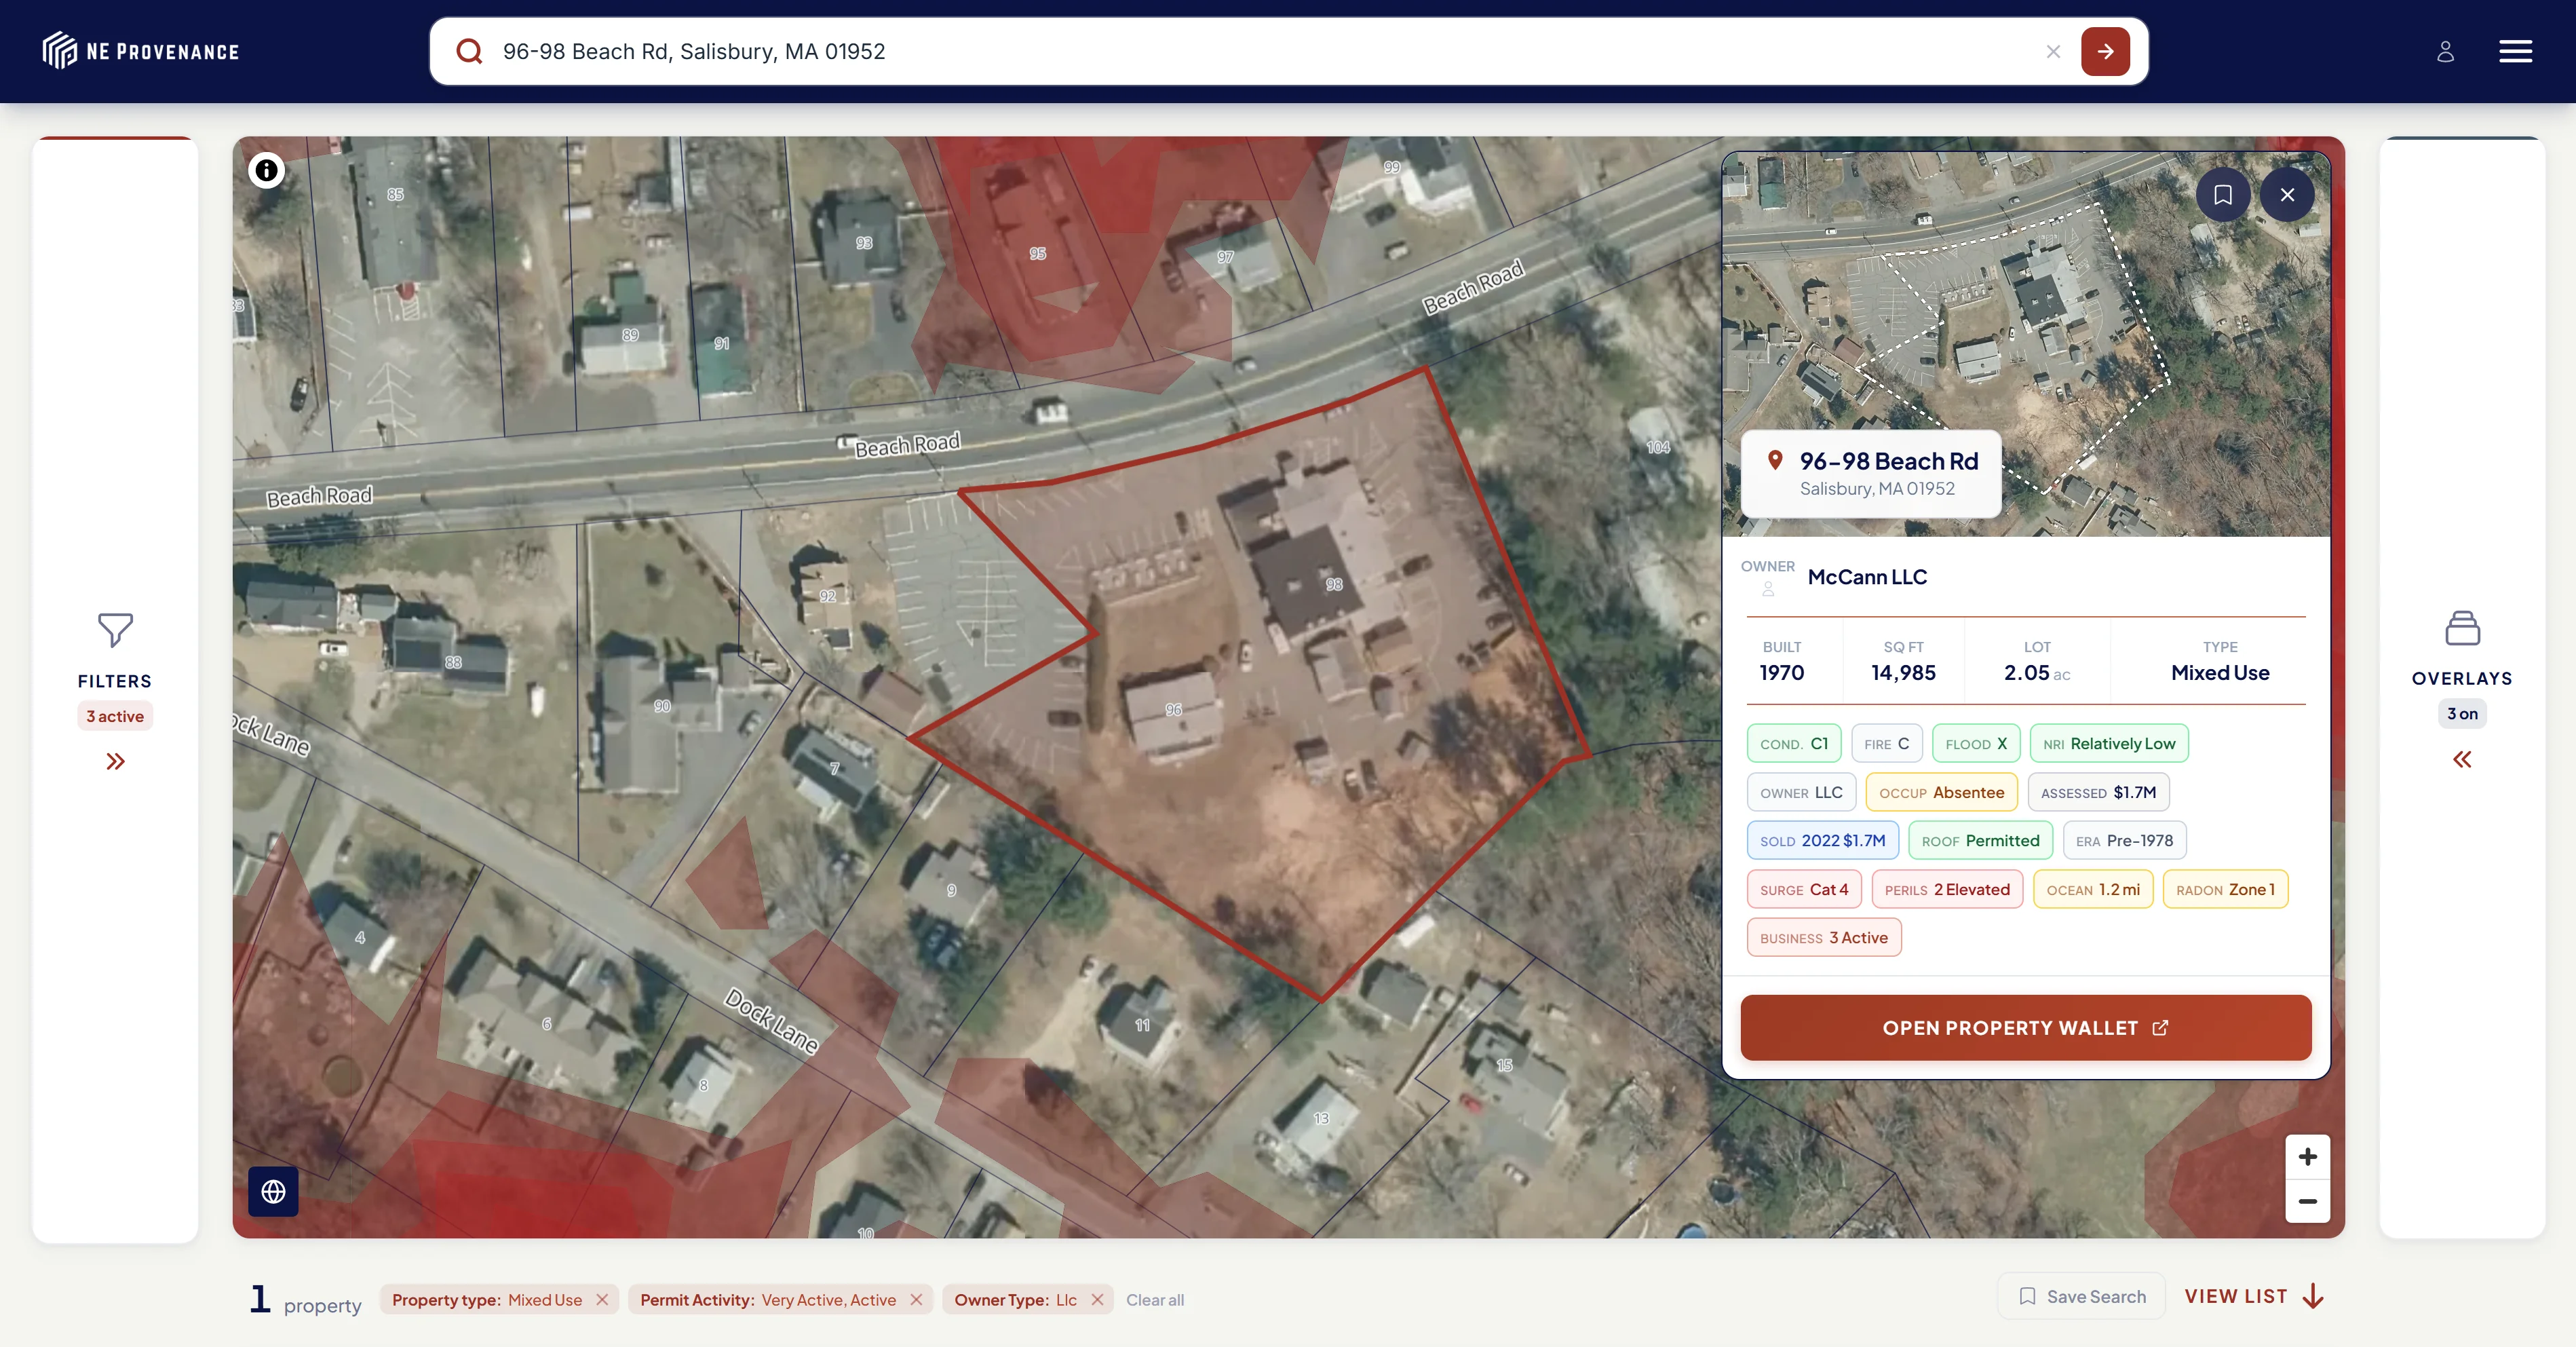
Highly targeted, AI-native search capabilities across 4.7 million properties, leveraging over 270 filter and 30 map overlay options. Search by address, owner, and property characteristics, or filter parcels by condition, risk exposure, ownership type, permit activity, flood zone, fire protection grade, and more. Layer environmental and hazard overlays directly on the map. Unlock portfolio-level insights, and then deep-dive into individual property-level intelligence.
The intelligence platform
What's in a Property Wallet?
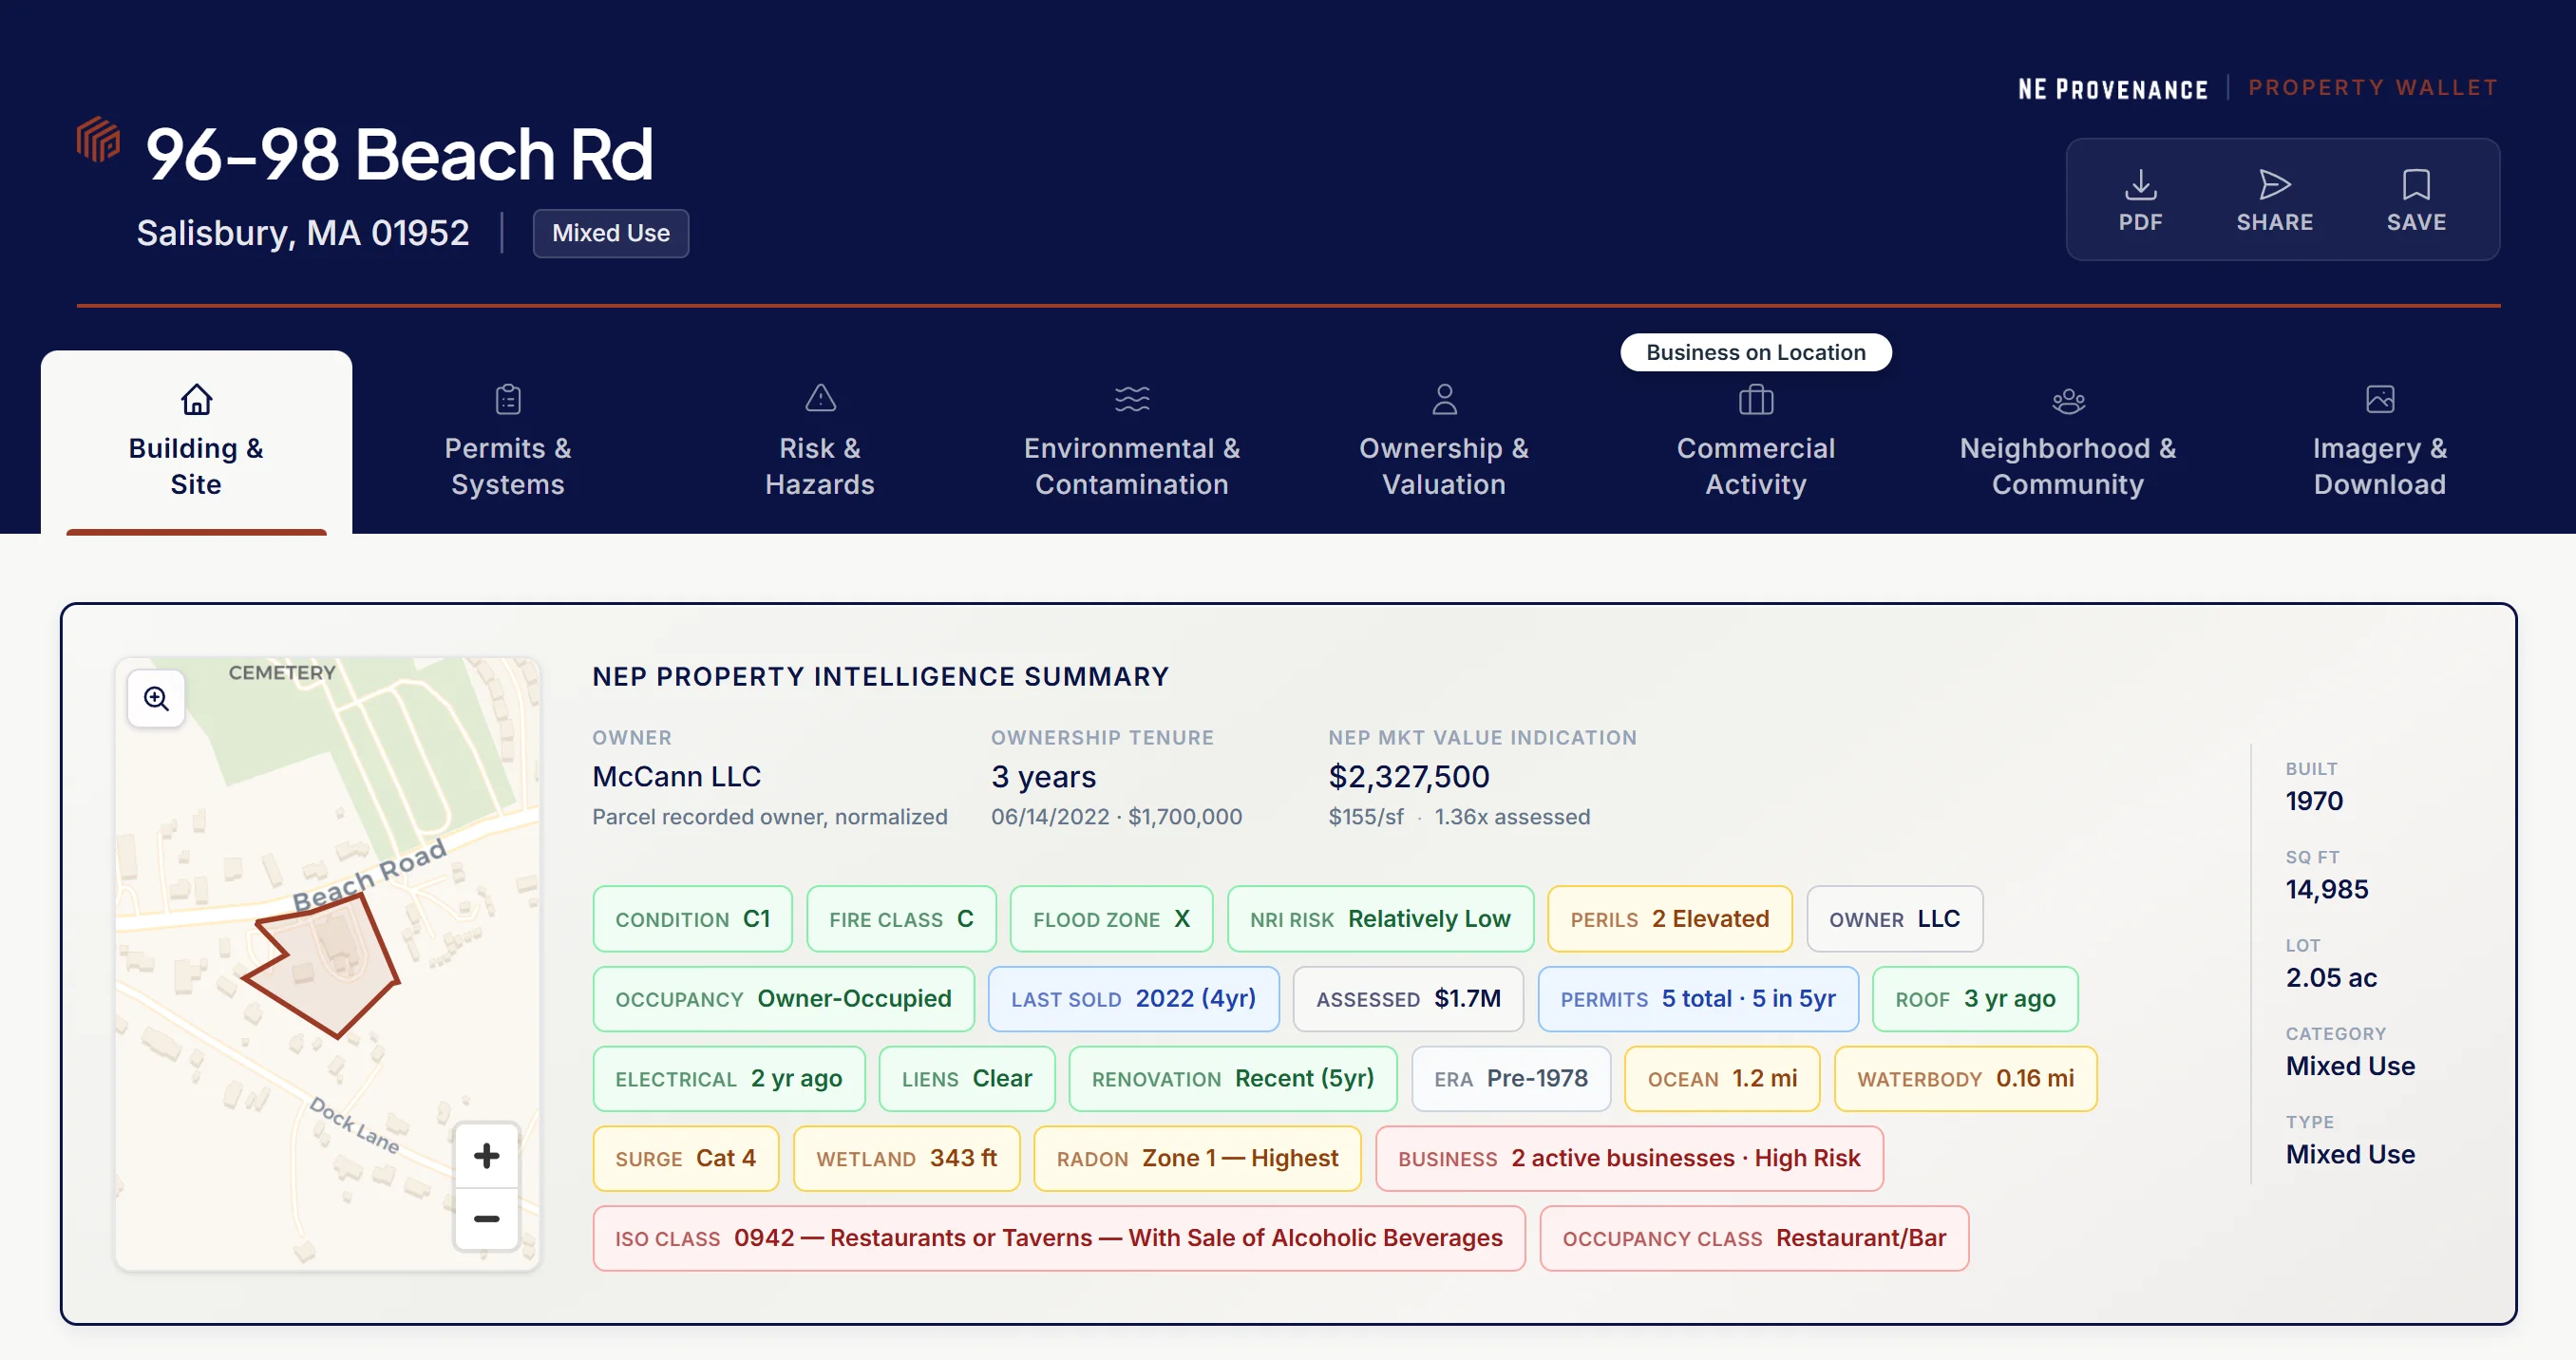
Every single property record in our coverage area is viewable in its own wallet. It's the visual display of every one of over 4.7 million property records, built by triangulating and corroborating data from 140+ primary and independent sources: assessor records, municipal permits, ownership data, registries of deeds, environmental data, enterprise partners, web enrichment, aerial imagery…. Aggregating, organizing, and cleaning the data is the first step. From it we derive professional intelligence and insights. Pro-grade intel, built to give you a data edge that AI can't.
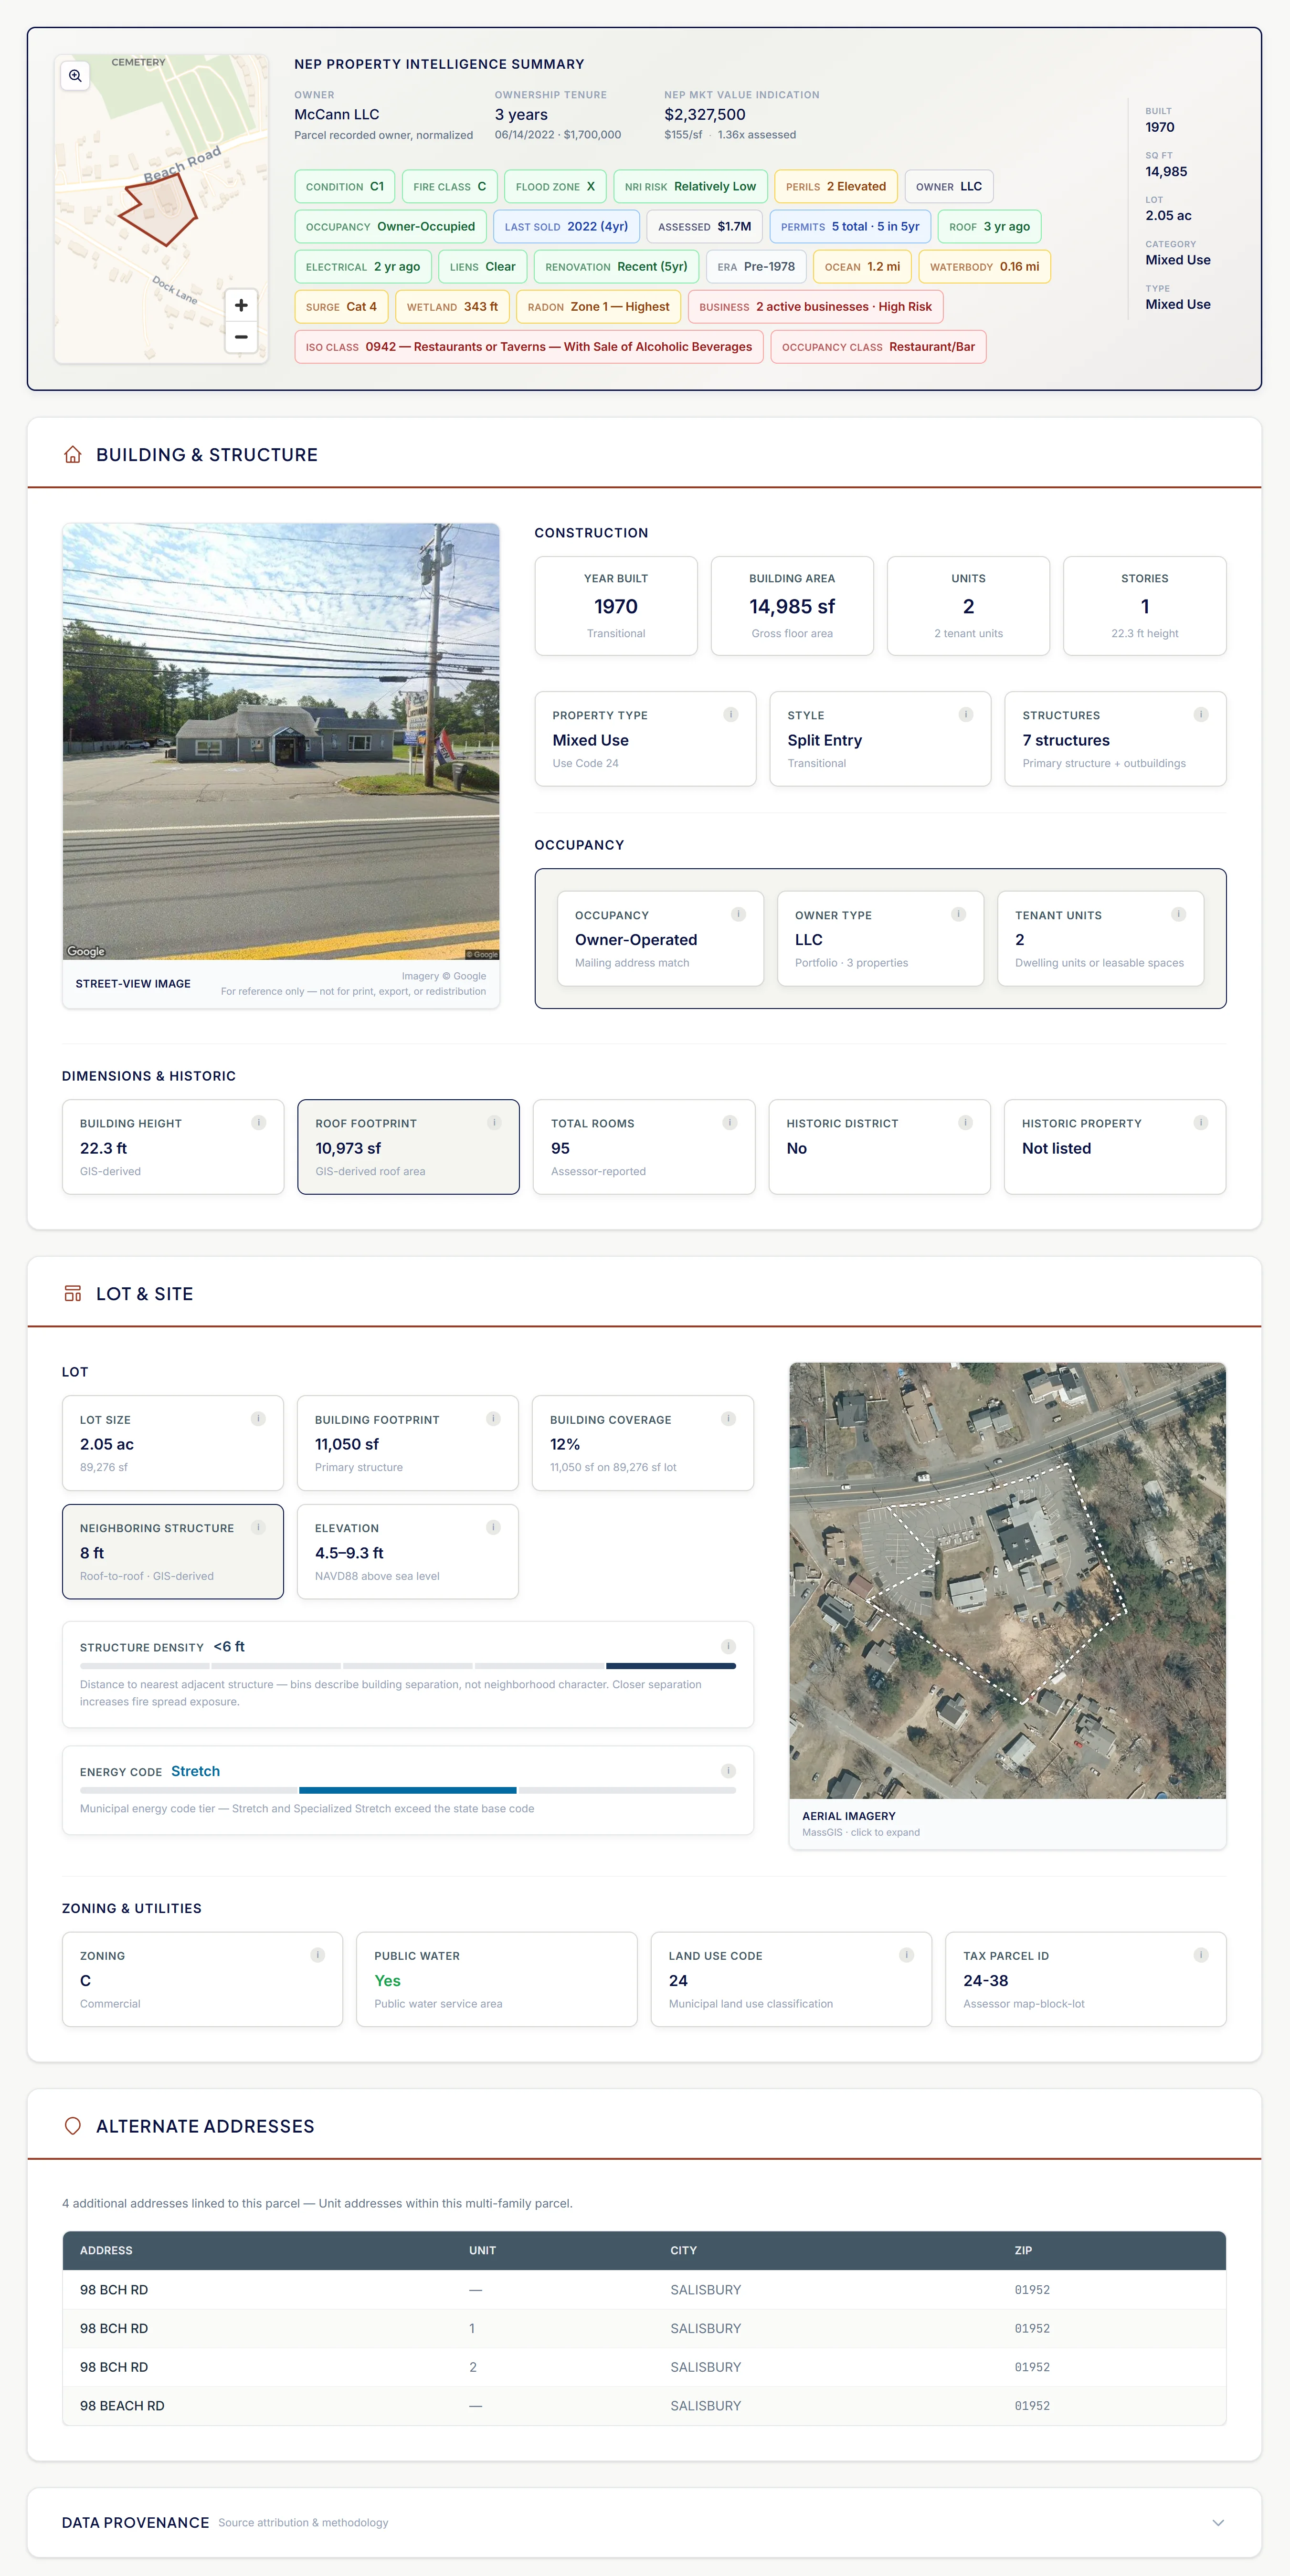
Year built, square footage, stories, bedrooms, bathrooms, construction type, architectural style, exterior and roof materials, foundation type, lot dimensions and acreage, zoning classification, land use code, occupancy status, number of units, heating and cooling systems, utility connections, garage and parking, building height, roof footprint, building coverage ratio, neighboring structure distance, density classification, energy code tier, elevation, and address verification with alternate addresses. The physical DNA of the property.
NEP Condition Estimate (C1–C6/NR) derived from permit timeline — not inferred from imagery. Individual system ages for electrical, plumbing, HVAC, and roof calculated from permit dates. Renovation detection for kitchen, bath, windows, siding, addition, and foundation. Equipment inventory including solar PV, pool, fireplace, and sprinkler systems. Permit activity scoring, maintenance evidence weighting, and building age context. Full permit history with dates, types, descriptions, and contractors. A well-maintained 1800 colonial and a well-maintained 2010 cape can both achieve C1.
NEP Fire Protection Grade (A–E) scoring fire station distance, building separation density, and municipal water service. FEMA flood zones with NFIP policy and claims data. NOAA SLOSH hurricane storm surge categories, sea level rise inundation modeling at 1, 3, and 6 feet, and mean higher high water tidal distance. ASCE 7-22 design wind speed, hail frequency and severity, USGS seismic hazard, USDA wildfire hazard potential, NRCS soil hydrology and drainage, radon zone, lead paint probability, vacancy risk indicators, and building liability composite. Commercial risk alerts for cooking, hazmat, alcohol, assembly, and lodging. FEMA National Risk Index expected annual loss, social vulnerability, and community resilience ratings.
National Wetlands Inventory classification and distance, dam exposure with hazard class and elevation-aware inundation risk, contamination records (MassDEP 21E sites, Activity and Use Limitations, underground storage tanks), EPA Brownfields and Superfund proximity, groundwater discharge permits, EJScreen environmental justice indicators, sole source aquifer and wellhead protection areas, NRHP and local historic district designation, conservation and protected lands, coastal zone classification, and environmental constraint count. Community-level environmental risk composites combining multiple federal and state datasets.
Owner name and normalized identity, entity type detection (individual, LLC, trust, corporation, estate, government), co-owner identification, corporate officer and agent data, mailing address with absentee and out-of-state classification, ownership tenure. Full deed chain with dates, instrument types, grantors, grantees, and sale prices. Mortgage and lien analysis with open balance indicators. Assessment breakdown (land, building, total), tax rate, annual tax bill. NEP Market Value Indication via LightGBM ensemble modeling. Similar sales scored across 25 weighted features with condition-rated comps. Portfolio detection across all owners in New England.
Business identity triangulated from Google Places, Foursquare, state corporate filings, business websites, and licensing databases. NEP Estimated ISO classification codes and commercial occupancy class. Risk activity flags: commercial cooking, alcohol service, hazmat storage, healthcare, assembly, lodging, and cannabis. Alcohol licensing from state ABCC/TTB/DBR. Multi-tenant detection, business count, and occupancy status. NEP Underwriting Risk Tier (Standard through Specialty). Federal firearms, exempt organization, and OSHA incident data where applicable.
Distance to nearest fire station, hospital, school, library, and open space. Traffic proximity percentile and rating. Census tract demographics including median household income, population density, housing vacancy rate, and owner-occupancy rate. School district proficiency scores. Electric utility provider and service territory. Public water and sewer service availability. Housing stock age distribution and median home value for the surrounding area. Opportunity zone designation. Community-level social vulnerability and resilience indicators from FEMA National Risk Index.
Google Street View integration, high-resolution state aerial imagery with parcel boundary overlay from all six New England state GIS programs, and interactive map with environmental and hazard overlays. AI-driven aerial classification for roof material, condition indicators, and property features. Download the full property intelligence report as a branded PDF, export structured data as CSV or JSON, generate shareable links with configurable access, and print. Bulk export and API access available for enterprise subscribers.
Solutions
Built for how you actually work
The same intelligence serves every professional who touches property risk, value, or condition. Your competitors are making decisions with less. You don't have to.

Why regional depth wins
Regional depth > national breadth
New England's built environment is unlike anywhere else in the country. Sixty percent of the housing stock predates 1970. Federals, Victorians, triple-deckers, converted mills, saltboxes, and gambrels — often on the same block.
Municipal governance is fragmented across 1,600+ cities and towns, each with different assessment practices, permitting systems, and recording methods. National data providers have consistently avoided this complexity because their models are optimized for homogeneous suburban development at scale.
The properties that need intelligence the most are the ones that have it the least. That's the gap we fill, allowing professionals to operate with an information edge that their competitors don't have.

Parcels
4.7M
86% of NE total (~5.5M)
Municipalities
781
cities & towns across 6 states
Est. premium
$7.4B
87% of NE insured value
Housing pre-1970
60%
the oldest housing stock in the U.S.
Check coverage for your city or town
Search by municipality name to see which intelligence layers are available.
Deep intelligence, triangulated & corroborated from multiple independent sources
Local & County
State Authorities
Industry & Standards
Federal Agencies
Work smarter
Intelligence built by experience
We're a different kind of data company, combining authoritative data sourcing, AI-native business infrastructure, and advanced data engineering with in-depth industry experience and local insights gained over nearly 50 years living and working in all six NE states.
NE Provenance is founded by someone who spent 17 years inside the property insurance industry — not observing it from the outside, but building data-driven underwriting & agent service organizations, data accuracy programs, and policy production operations for a Top-5 U.S. national carrier. Combined with years of work on AI, data, research, and analytics, experience forms the foundation for the NEP intelligence platform.
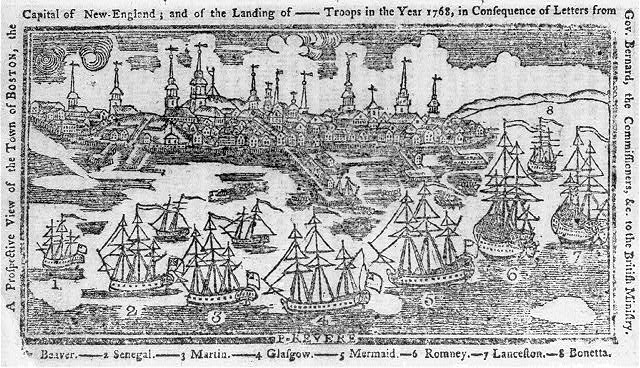
High-quality property data — let alone “intelligence” — is difficult to come by, especially for New England. We're seeking to change that, especially for New England.
If your product touches property data in NE, connect with us. Partnerships are founder-led, focused on win-win solutions that sync our intelligence with your expertise. Work smarter, with better data.
Based in Newburyport, MA and Hampton, NH, we're building the professional property intelligence record for the region we know — its housing stock, its small businesses, its municipal systems, its weather, its risks and its complexity.
High-quality property data — let alone “intelligence” —
is difficult to come by, especially for New England.
We're seeking to change that, especially for New England.
Explore the intelligence for yourself
Open a Property Wallet for a real New England property. With over 4.7 million similar records across all six New England states, see how it fits into your workflow.