Lynnfield, MA
Tracking 4,641 properties across Lynnfield, Massachusetts — a community where the median home dates to 1960 and the oldest to 1667. Every parcel mapped with building characteristics, environmental exposure, hazard risk, and ownership history assembled from 140+ sources.
Lynnfield, MAInc. 1638
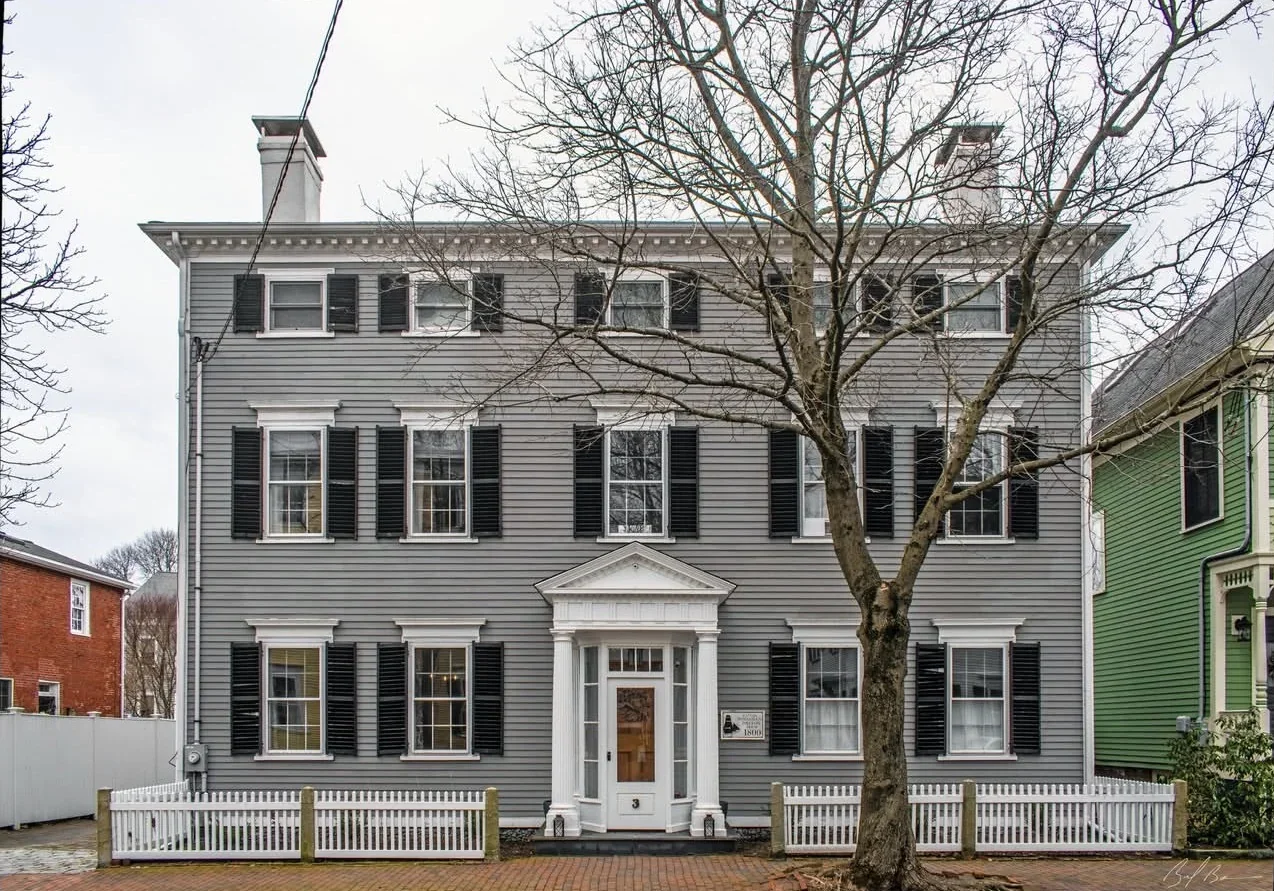
Lynnfield is a residential suburb positioned between the denser North Shore cities and the more rural inland communities. The town's housing stock is predominantly single-family homes built during the post-war suburban expansion of the 1950s-70s, with newer construction filling in remaining lots and replacing older homes. The commercial activity along Route 1 — including the MarketStreet development — contrasts with the quiet residential neighborhoods that make up most of the town.
Suntaug Lake in the center of town creates a small cluster of waterfront properties, but Lynnfield's defining characteristic is its consistency — a suburban community with good schools, well-maintained homes, and assessed values that sit in a relatively narrow band compared to the more varied North Shore markets. For professionals, the uniformity makes comparable analysis more straightforward than in neighboring communities with wider value spreads.
Risk Profile
FEMA flood zones, fire protection grades, radon — parcel by parcel
FEMA Flood Zones
732 properties (16%) are in FEMA Special Flood Hazard Areas, where flood insurance is required for federally-backed mortgages.
Fire Protection Grades
Fire protection grades reflect proximity to fire stations and hydrant infrastructure. Grade affects insurance pricing in every New England state.
The Property Landscape
4,641 properties · Median year built 1960 · Avg 3,261 sf
Property Types
Construction by Era
Architectural Styles
Market Activity
Recorded transactions from Essex County Registry of Deeds
NE Provenance tracks recorded deeds, mortgages, and liens for 95% of Lynnfield properties. Ownership intelligence includes transaction history, entity detection, portfolio identification, and lien analysis — assembled from public registry records into a single property-level profile.
Building Permits & Maintenance
18,006 municipal building permits on file · 70% of properties
NE Provenance tracks 18,006 building permits across 3,266 Lynnfield properties — 70% coverage. 1,673 properties have permit activity in the last five years.
Each permit record reveals maintenance decisions: roof replacements, electrical upgrades, kitchen renovations, solar installations. For insurance, lending, and appraisal professionals, permit history is the most objective evidence of property condition available from public records.
Living in Lynnfield
Essex County · Massachusetts
Lynnfield covers 10.4 square miles in Essex County, Massachusetts. The median assessed property value is $876K.
Single-family homes account for 3,887 of Lynnfield's 4,641 properties, with 170 condominiums and 87 multi-family buildings. There are 73 commercial properties and 134 parcels of vacant land. About 86% of properties are owner-occupied.
Assessed values range widely — the middle 50% of properties fall between $732K and $1.1M, with the highest assessed property at $266.8M. For professionals working in this market, the value spread tells you a lot about what you'll encounter door to door.
Most properties rely on private septic systems. Electric service is provided by Peabody Municipal Light Plant / Reading Municipal Light. 704 properties have identified commercial activity — restaurants, retail, professional offices, and services that give Lynnfield its character. 187 properties have swimming pools.
Environmental note: Lynnfield has an average EPA lead paint indicator at the 66th percentile nationally, consistent with 96 properties built before 1900 when lead paint was standard. 988 properties exceed at least one EPA environmental justice threshold — a factor in lending compliance and environmental due diligence.
What Lynnfield Property Intelligence Means for Professionals
Insurance & Underwriting
Lynnfield's fire protection grade distribution (9 Grade A, 1,616 Grade B) directly affects premium calculation. Parcel-level hazard data provides the granularity that ZIP-level aggregation misses.
Insurance solutionsReal Estate & Appraisal
Lynnfield's 10 property types, spanning construction from 1667 to present, require local market knowledge for accurate comparable selection and valuation. NEP assembles building characteristics, environmental exposure, and condition signals into a single property profile.
Real estate solutionsLending & Title
Collateral assessment requires flood zone verification, environmental screening, and ownership chain validation. 16% of Lynnfield properties are in SFHAs where flood insurance is a federal lending requirement. NEP provides property-level compliance data from public records.
Lending solutionsInspection & Property Services
18,006 permits across 70% of properties means most Lynnfield inspection assignments can start with documented renovation and system history, not a blank slate.
Inspection solutionsExplore Lynnfield property intelligence.
4,641 Lynnfield properties — each with risk profiles, building data, permit history, and ownership analysis from 140+ sources. Open any property and see the full picture.
Source: NE Provenance, “Professional Property Intelligence for New England,” neprovenance.com/insights/town/lynnfield-ma. For references or attribution, please link back to this page or neprovenance.com. Thank you, we appreciate it.