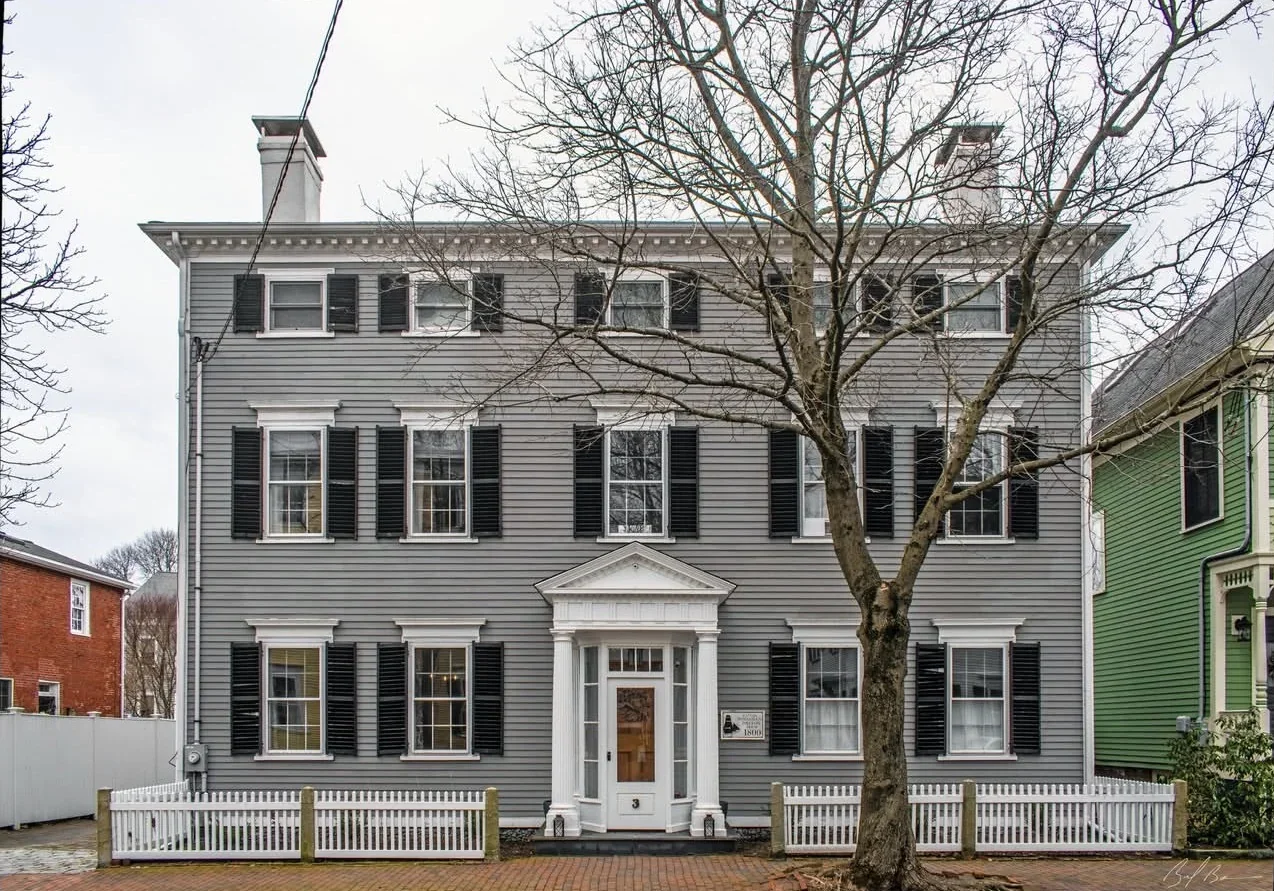
East Granby, CT
Tracking 4,816 properties across East Granby, Connecticut — a community where the median home dates to 1965. Every parcel mapped with building characteristics, environmental exposure, hazard risk, and ownership history assembled from 140+ sources.
East Granby, CTInc. 1858
East Granby is a small, suburban town north of Hartford along Route 20, with a mix of residential development and the remaining agricultural land that once defined northern Hartford County.
For property professionals, East Granby is a small, moderate suburban market with limited commercial activity.
Risk Profile
FEMA flood zones, fire protection grades, radon — parcel by parcel
FEMA Flood Zones
300 properties (6%) are in FEMA Special Flood Hazard Areas, where flood insurance is required for federally-backed mortgages.
Fire Protection Grades
Fire protection grades reflect proximity to fire stations and hydrant infrastructure. Grade affects insurance pricing in every New England state.
The Property Landscape
4,816 properties · Median year built 1965 · Avg 2,190 sf
Property Types
Construction by Era
Market Activity
Recorded transactions from Capitol Registry of Deeds
NE Provenance tracks recorded deeds, mortgages, and liens for 98% of East Granby properties. Ownership intelligence includes transaction history, entity detection, portfolio identification, and lien analysis — assembled from public registry records into a single property-level profile.
Living in East Granby
Capitol · Connecticut
East Granby covers 17.6 square miles in Capitol, Connecticut. The median assessed property value is $229K.
Single-family homes account for 1,773 of East Granby's 4,816 properties, with 483 condominiums. There are 58 commercial properties. About 73% of properties are owner-occupied, and 2% are owned by someone out of state.
Assessed values range widely — the middle 50% of properties fall between $173K and $297K, with the highest assessed property at $161.3M. For professionals working in this market, the value spread tells you a lot about what you'll encounter door to door.
Most properties rely on private septic systems, and 37% have public water service. Electric service is provided by FARMINGTON RIVER POWER COMPANY. 547 properties have identified commercial activity — restaurants, retail, professional offices, and services that give East Granby its character.
What East Granby Property Intelligence Means for Professionals
Insurance & Underwriting
East Granby's fire protection grade distribution (214 Grade A, 709 Grade B) directly affects premium calculation. Parcel-level hazard data provides the granularity that ZIP-level aggregation misses.
Insurance solutionsReal Estate & Appraisal
East Granby's 10 property types require local market knowledge for accurate comparable selection and valuation. NEP assembles building characteristics, environmental exposure, and condition signals into a single property profile.
Real estate solutionsLending & Title
Collateral assessment requires flood zone verification, environmental screening, and ownership chain validation. 6% of East Granby properties are in SFHAs where flood insurance is a federal lending requirement. NEP provides property-level compliance data from public records.
Lending solutionsInspection & Property Services
Understanding a property's construction era, environmental exposure, and building characteristics before arriving on site transforms inspection from discovery to verification.
Inspection solutionsExplore East Granby property intelligence.
4,816 East Granby properties — each with risk profiles, building data, permit history, and ownership analysis from 140+ sources. Open any property and see the full picture.
Source: NE Provenance, “Professional Property Intelligence for New England,” neprovenance.com/insights/town/east-granby-ct. For references or attribution, please link back to this page or neprovenance.com. Thank you, we appreciate it.