
Boston, MA
Suffolk County42.3588°N, 71.0578°W
Tracking 180,510 properties across Boston, Massachusetts — a community where the median home dates to 1920 and the oldest to 1725. Every parcel mapped with building characteristics, environmental exposure, hazard risk, and ownership history assembled from 140+ sources.
180,510
Properties Tracked
1920
Median Year Built
$613K
Median Assessed Value
5%
FEMA Flood Zone
50.80M
NEP Data Facts Tracked
3%
Coastal Zone
Click any parcel to view intelligence
Boston, MA
Boston is the capital of Massachusetts and the largest city in New England — a property market of extraordinary complexity spread across neighborhoods that function as distinct markets within a single municipality. From the brownstones of Back Bay and the South End to the triple-deckers of Dorchester and Roxbury, from the waterfront towers of the Seaport to the single-family homes of West Roxbury and Roslindale, Boston contains more property diversity in its 90 square miles than most states.
The city's geography — a harbor, a river, and neighborhoods built on filled tidal flats — creates environmental exposure that varies block by block. Coastal flood zones run through the Seaport, East Boston, and Charlestown. The older neighborhoods bring construction that ranges from pre-Revolutionary homes in the North End to the Victorian-era housing stock that dominates most residential areas. Boston's institutional presence — more than 30 colleges and universities, world-class hospitals — creates massive land use concentrations that affect surrounding property markets.
For property professionals, Boston requires parcel-level intelligence by definition. A condo in the Back Bay and a triple-decker in Mattapan are both "Boston residential properties," but they exist in different markets with different risk profiles, different buyer pools, and different regulatory environments. ZIP-code or city-level generalizations are meaningless in a city where assessed values can vary by a factor of 50 within a single neighborhood.
Risk Profile
FEMA flood zones, fire protection grades, radon, coastal exposure, storm surge — parcel by parcel
FEMA Flood Zones
9,225 properties (5%) are in FEMA Special Flood Hazard Areas, where flood insurance is required for federally-backed mortgages.
X
171,284
AE
8,909
VE
313
A
2
AO
1
AREA NOT INCLUDED
1
Fire Protection Grades
Fire protection grades reflect proximity to fire stations and hydrant infrastructure. Grade affects insurance pricing in every New England state.
Grade A
32,932
Grade B
140,609
Grade C
5,103
Grade D
1,858
Grade E
8
Coastal & Water Exposure
5,802 properties (3%) are within 3 miles of the ocean. 7,768 are classified as waterfront. The closest property is 133 ft from the coastline.
4,217
SLR 1 ft
Properties affected
4,252
SLR 3 ft
Properties affected
42,622
SLR 6 ft
Properties affected
74,489
Surge Exposure
Cat 1/2/3/4
6,743
Estuary
Waterfront
121
Pond
Waterfront
21
Lake
Waterfront
Zone 1
Radon Risk
123 mph
Design Wind Speed
ASCE 7 standard
40 psf
Ground Snow Load
ASCE 7 standard
Very Low
FEMA Risk Index
NRI composite rating
The Property Landscape
180,510 properties · Median year built 1920 · Avg 7,505 sf
Property Types
Condominium
88,684
Single Family
35,299
Institutional
18,379
Three-Family
13,344
Residential Other
8,519
Multi-Family
6,272
Commercial
6,044
Mixed Use
3,008
Industrial
623
Vacant Land
328
Construction by Era
Pre-1800
11
1800-1849
546
1850-1899
32,304
1900-1949
76,716
1950-1979
15,570
1980-1999
14,317
2000+
26,636
Building Permits & Maintenance
378,773 municipal building permits on file · 32% of properties
NE Provenance tracks 378,773 building permits across 57,145 Boston properties — 32% coverage. 30,958 properties have permit activity in the last five years.
Each permit record reveals maintenance decisions: roof replacements, electrical upgrades, kitchen renovations, solar installations. For insurance, lending, and appraisal professionals, permit history is the most objective evidence of property condition available from public records.
378,773
Permits on File
32%
Coverage
Properties with permits
30,958
Active (5yr)
Recent permit activity
92%
Condition Rated
NEP assessment
Living in Boston
Suffolk County · Massachusetts
Zip Codes0202602108021090211002111021130211402115021160211802119021200212102122021240212502126021270212802129021300213102132021330213402135021360213702199022010221002215022190244502467
VillagesAllstonBack BayBeacon HillBrightonCharlestownChinatownDorchesterEast BostonFenwayFinancial DistrictHyde ParkJamaica PlainMattapanMission HillNorth EndReadvilleRoslindaleRoxburySouth BostonSouth EndWaterfrontWest EndWest Roxbury
180,510
Properties
$613K
Median Assessed
57%
Owner-Occupied
50.0
Square Miles
Boston covers 50.0 square miles in Suffolk County, Massachusetts. The median assessed property value is $613K.
Single-family homes account for 35,299 of Boston's 180,510 properties, with 88,684 condominiums and 19,621 multi-family buildings. There are 6,044 commercial properties and 328 parcels of vacant land. About 57% of properties are owner-occupied, and 4% are owned by someone out of state.
Assessed values range widely — the middle 50% of properties fall between $382K and $917K, with the highest assessed property at $2143.1M. For professionals working in this market, the value spread tells you a lot about what you'll encounter door to door.
Most of Boston (99%) is on municipal sewer. Electric service is provided by NSTAR ELECTRIC COMPANY. 10,973 properties have identified commercial activity — restaurants, retail, professional offices, and services that give Boston its character.
Environmental note: Boston has an average EPA lead paint indicator at the 64th percentile nationally, consistent with 32,861 properties built before 1900 when lead paint was standard. 116,016 properties exceed at least one EPA environmental justice threshold — a factor in lending compliance and environmental due diligence.
What Boston Property Intelligence Means for Professionals
Insurance & Underwriting
With 5% of properties in FEMA flood zones and 3% in the coastal zone, Boston concentrates several major underwriting variables. Parcel-level hazard data provides the granularity that ZIP-level aggregation misses.
Insurance solutionsReal Estate & Appraisal
Boston's 10 property types, spanning construction from 1725 to present, require local market knowledge for accurate comparable selection and valuation. NEP assembles building characteristics, environmental exposure, and condition signals into a single property profile.
Real estate solutionsLending & Title
Collateral assessment requires flood zone verification, environmental screening, and ownership chain validation. 5% of Boston properties are in SFHAs where flood insurance is a federal lending requirement. NEP provides property-level compliance data from public records.
Lending solutionsInspection & Property Services
378,773 permits across 32% of properties means most Boston inspection assignments can start with documented renovation and system history, not a blank slate.
Inspection solutionsExplore Boston property intelligence.
180,510 Boston properties — each with risk profiles, building data, permit history, and ownership analysis from 140+ sources. Open any property and see the full picture.
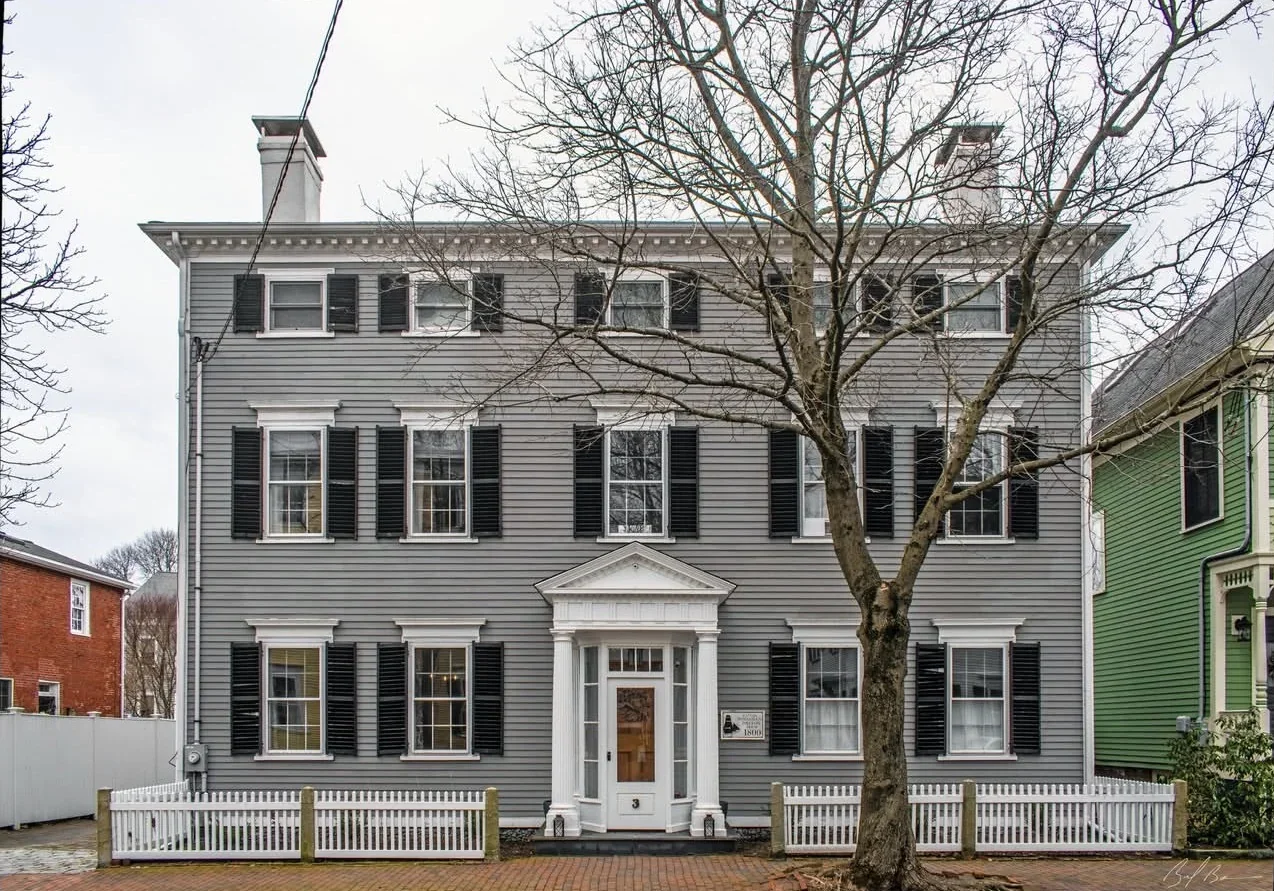
Newburyport, MA · Federalist · 3,524 sq ft · 4 bed / 3 bath · Built 1800 · Historic District
NEP Property Intelligence Summary
ConditionC1Fire ClassBFlood ZoneXOwnerIndividualOccupancyOwner-Occupied
Purchased2018 (8yr)Permits11 totalSystems3 updatedLiensClearAssessed$1.6MOcean0.3 mi
EraPre-1940HistoricDesignatedRenovationRecentRadonZone 1
Cite this data
Source: NE Provenance, “Professional Property Intelligence for New England,” neprovenance.com/insights/town/boston-ma. For references or attribution, please link back to this page or neprovenance.com. Thank you, we appreciate it.